TAKEAWAYS
- Contrarian investing wisdom suggests that opposing the general market sentiment can lead to viable market opportunities
- The Williams Sentiment Index measures the prevailing opinions and sentiment of financial advisors and offers insights into potential market turns
- The Williams Sentiment Index indicates when investor sentiment is exceedingly bullish or bearish

Contrarian wisdom is nothing new to the market's ears, and it probably speaks to you with some familiarity. You know what it generally says ...
- "Be fearful when others are greedy, and greedy when others are fearful." (Warren Buffett)
- "The time of maximum pessimism is the best time to buy, and the time of maximum optimism is the best time to sell." John Templeton
Those are two of the more famous maxims. There are hundreds more, and they say pretty much the same thing. If there's anything we can learn from this, it's the idea that "most of the time, the crowd is wrong," to quote Larry Williams himself.
Though top traders and investors have been repeating these maxims like centuries-old vinyl stuck on a repeating groove, it tells us that the contrarian message penetrates us like water penetrating a dry stone. Meaning hardly anyone follows it.
If true, wouldn't this give you something of a perpetual edge? All you'd need is a reliable means to measure crowd sentiment.
So How Can You Reliably Measure Crowd Sentiment?
A simple but laborious way to do this is to measure what most analysts and influencers are saying. This was easier done before the digital age, when most materials were published in print. As Larry Williams put it, Jim Sibbet pioneered this kind of analysis in the 1960s, when he measured the percentage of bullish newsletters on given commodities.
Nowadays, it's tougher. There are thousands of content channels—from print and television to social media networks, blogs, and podcasts—to consider. Plus, you have a large crowd of influencers who may or may not be financially savvy, yet many people follow them anyway.
The Williams Sentiment Index: What It Measures and How to Interpret It
The Williams Sentiment Index is an indicator Larry Williams developed to measure and display what many financial analysts and advisors say about a given market. It's a contrarian indicator available as a plug-in in StockChartsACP.
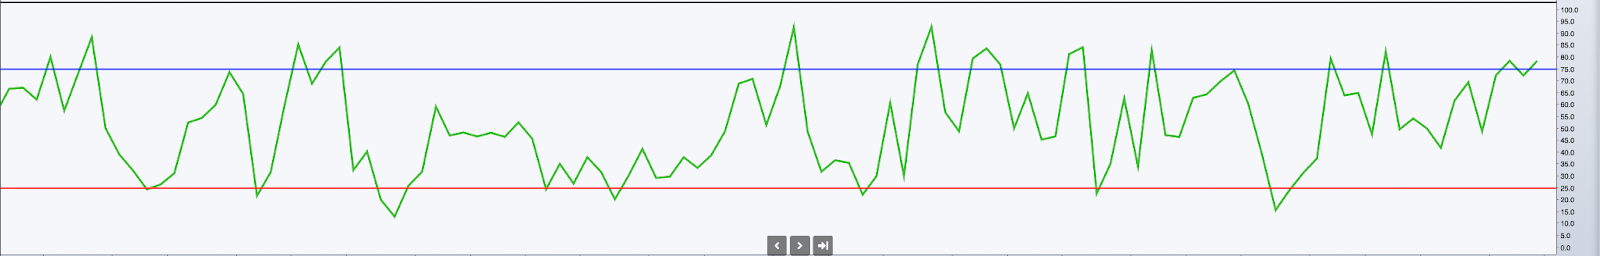
CHART 1: A CLOSER LOOK AT THE WILLIAMS SENTIMENT INDEX. The blue and red lines are thresholds for bullish and bearish investor sentiment.Chart source: StockChartsACP. For educational purposes.
The indicator is relatively simple to use. The blue and red lines are threshold levels for bullish and bearish sentiment.
- Exceedingly Bullish. When the index crosses above the blue line, it indicates that investor sentiment may be too bullish on a given stock and that a decline is likely to emerge. This is a signal to sell.
- Exceedingly Bearish. When the index crosses below the red line, it indicates investor sentiment may be too bearish and that a rally is likely to emerge. This is a signal to buy.
In terms of timeframe, the Williams Sentiment Index is designed for weekly and daily charts. This makes sense, considering advisors' focus on intermediate-to-longer-term timeframes.
The Williams Sentiment Index in Action
Let's look at a weekly chart of Cisco (CSCO) to see how the Williams Sentiment Index might have given a glimpse of market turns before they happened.
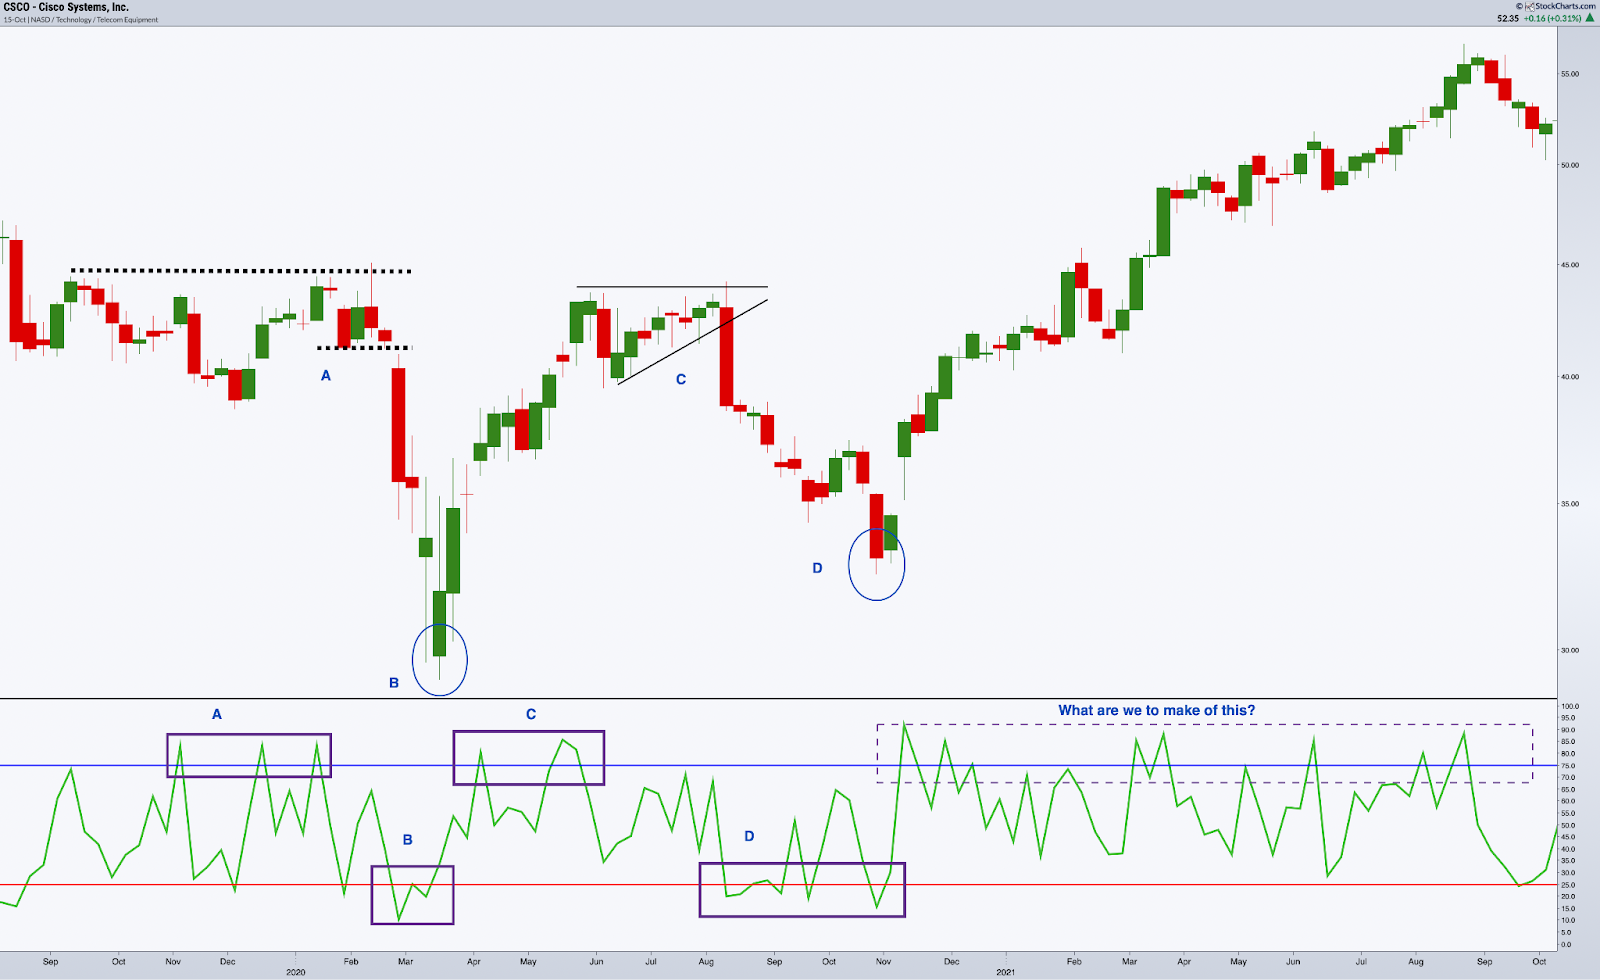
CHART 2: WILLIAMS SENTIMENT INDEX IDENTIFYING EXTREMELY BULLISH AND BEARISH INVESTOR SENTIMENT. When reading this indicator, it's important to focus on context.Chart source: StockChartsACP. For educational purposes.
Like every indicator, don't treat every signal with equal significance. Context is king.

A— The Williams Sentiment Index signals extreme bullishness, considering how the index spiked above the blue line three times. But what was it spiking against? A resistance level that seemed to hold. That should have told you something—namely, weakening momentum contradicted the bullish sentiment. Prices plunged in a few weeks after the last signal.
B— The index fell below the red line, indicating extreme bearishness. This coincides with prices bottoming out (see green circle).
C— The resistance level a few weeks earlier served as a technical headwind for the rallying stock. Note that prices formed an ascending triangle, which was a bullish indication. However, the extremely bullish sentiment indicated by the index suggested that prices would fall, which eventually happened.
D— As the index shows, now, market sentiment is even more bearish than before. Interestingly, this extreme bearishness marked the beginning of a nine-month uptrend.
What about the subsequent bullish readings? The indicator revealed ultra-bullish readings, yet prices continued to rally. Here's a question: Once the breakout above the critical resistance area (shown on the left side of the chart) marked the beginning of a strong uptrend, would you go short because the Williams Sentiment Index signaled potential bullish exuberance? The smart answer is "no", because it would put you on the wrong side of the market. Those readings are insignificant, and the price action that just took place gives you a strong indication that the index readings are producing noise. As we said earlier, context is king.
Prices eventually declined, but you shouldn't take action until you get confirmation of a reversal.
Now, let's see how this applies to a daily chart. Below is a chart of Bank of America (BAC).
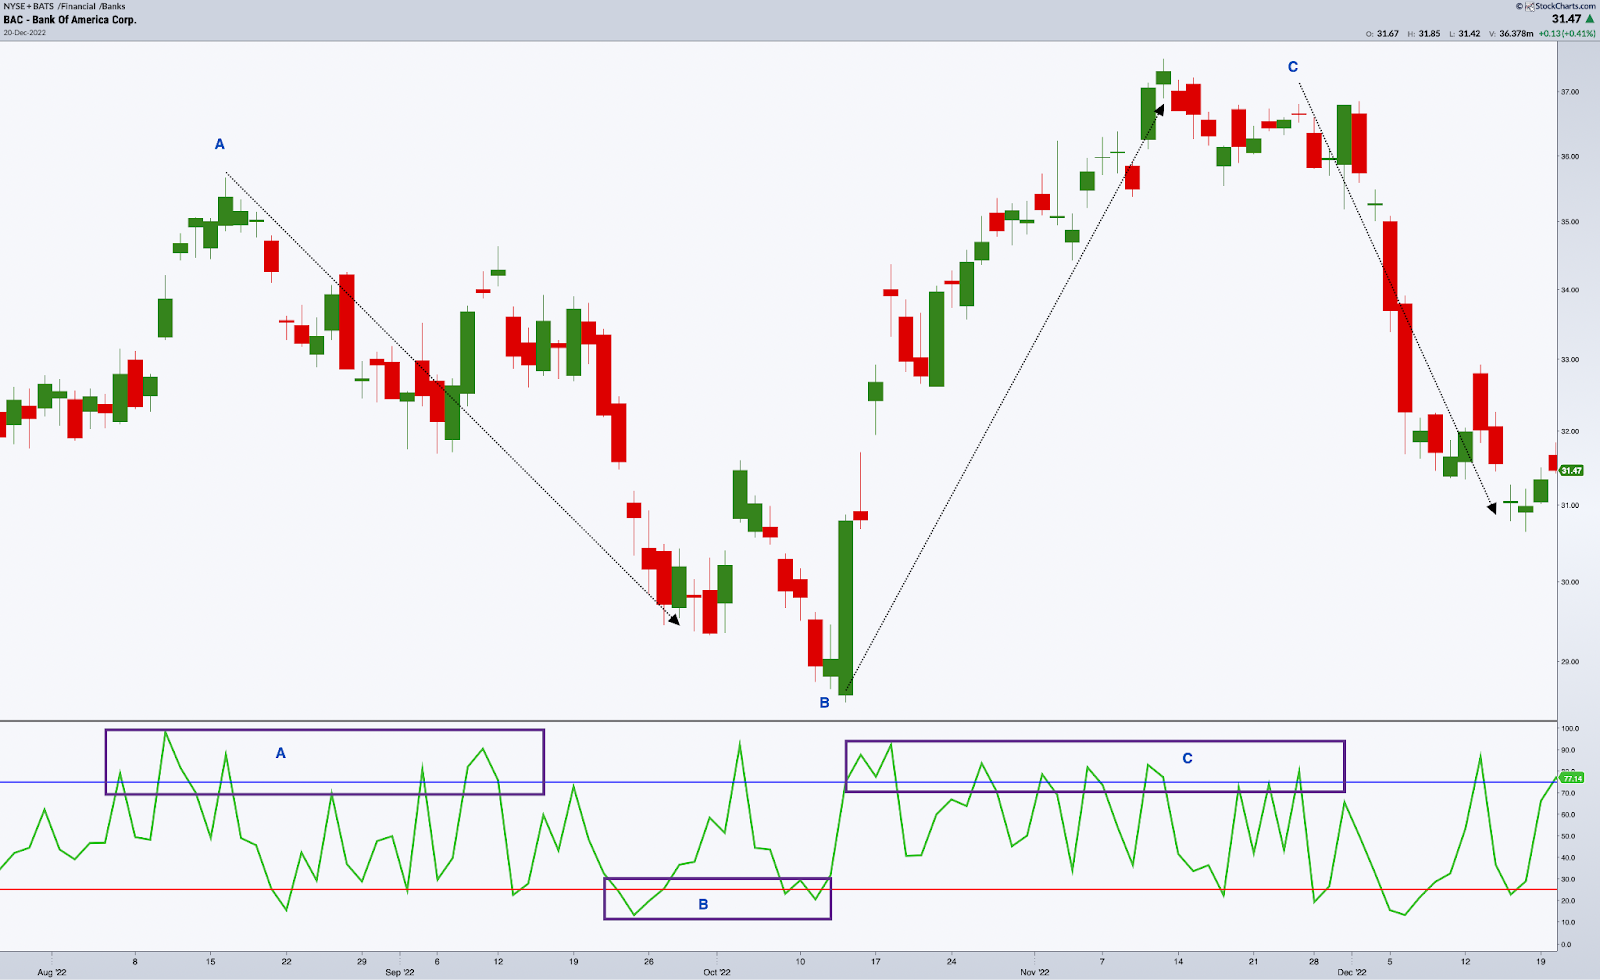
CHART 3: WILLIAMS SENTIMENT INDEX APPLIED TO BANK OF AMERICA. The indicator anticipated market reversals, but each instance unfolded differently.Chart source: StockChartsACP. For educational purposes.
A— Sentiment was hitting several highs. Interestingly, market sentiment was bullish while price was falling, until the crowds quickly realized they were on the wrong side of the market.
B— Maximum bearishness took hold just as the "informed money" started accumulating shares, as evidenced by the sharp six-week rally that followed. As contrarian wisdom suggests, buy when everyone is most bearish.
C— In this case, the financial crowd was generally in sync with the informed-money crowd. During this period, the index highs gradually tapered off, peppered in with a few index lows. How do you interpret these seemingly mixed signals? Pay attention to the context. When prices are trending up, wait for the trend to break down before you decide to sell, lighten your load, or go short.
So, generally, you get the picture, plus a general idea as to how you can use this tool.
The Bottom Line
The age-old wisdom of contrarian thinking says that going against the crowd often presents the best market opportunities. Yet, only some heed this advice. A contrarian approach isn't for everyone. But if it resonates with you, or if you're already going against the grain of popular market-think, then the Williams Sentiment Index might be a good addition to your arsenal. Happy trading!
Disclaimer: This blog is for educational purposes only and should not be construed as financial advice. The ideas and strategies should never be used without first assessing your own personal and financial situation, or without consulting a financial professional.