TAKEAWAYS
- Overall, the stock market has managed to hold on to its upward rally even in spite of a pullback
- Crude oil prices rose on news of production cuts
- Treasury yields rose on the jobs report data

The much-awaited August jobs report was released on Friday. While it came in higher than estimates—187K vs. 170K jobs created—there were other areas of the report that eclipsed the stronger-than-expected figure.
Notably, the average wage increase was less than expected, and average hourly earnings rose 0.2%. What moved the needle there was that the revised job gains numbers for June and July, which went downward by a significant amount. Additionally, the labor force participation rate rose by 0.2 percentage points, and there was an increase in the number of people entering the workforce. The healthcare sector saw the most job increases, with leisure and hospitality, social assistance, and construction not far behind. This was welcome news for the stock market—an increase in workers can bring down wage inflation.
What It Means for the Financial Market
Does the jobs report show enough cooling in the labor market for the Fed to stop raising interest rates? Let's look at some areas of the stock market that tend to react to the jobs data.
The 10-year Treasury Yield closed higher. After pulling back from reaching a high of 4.36%, yields rose closing at 4.17%, which is above the 21-day exponential moving average (EMA).
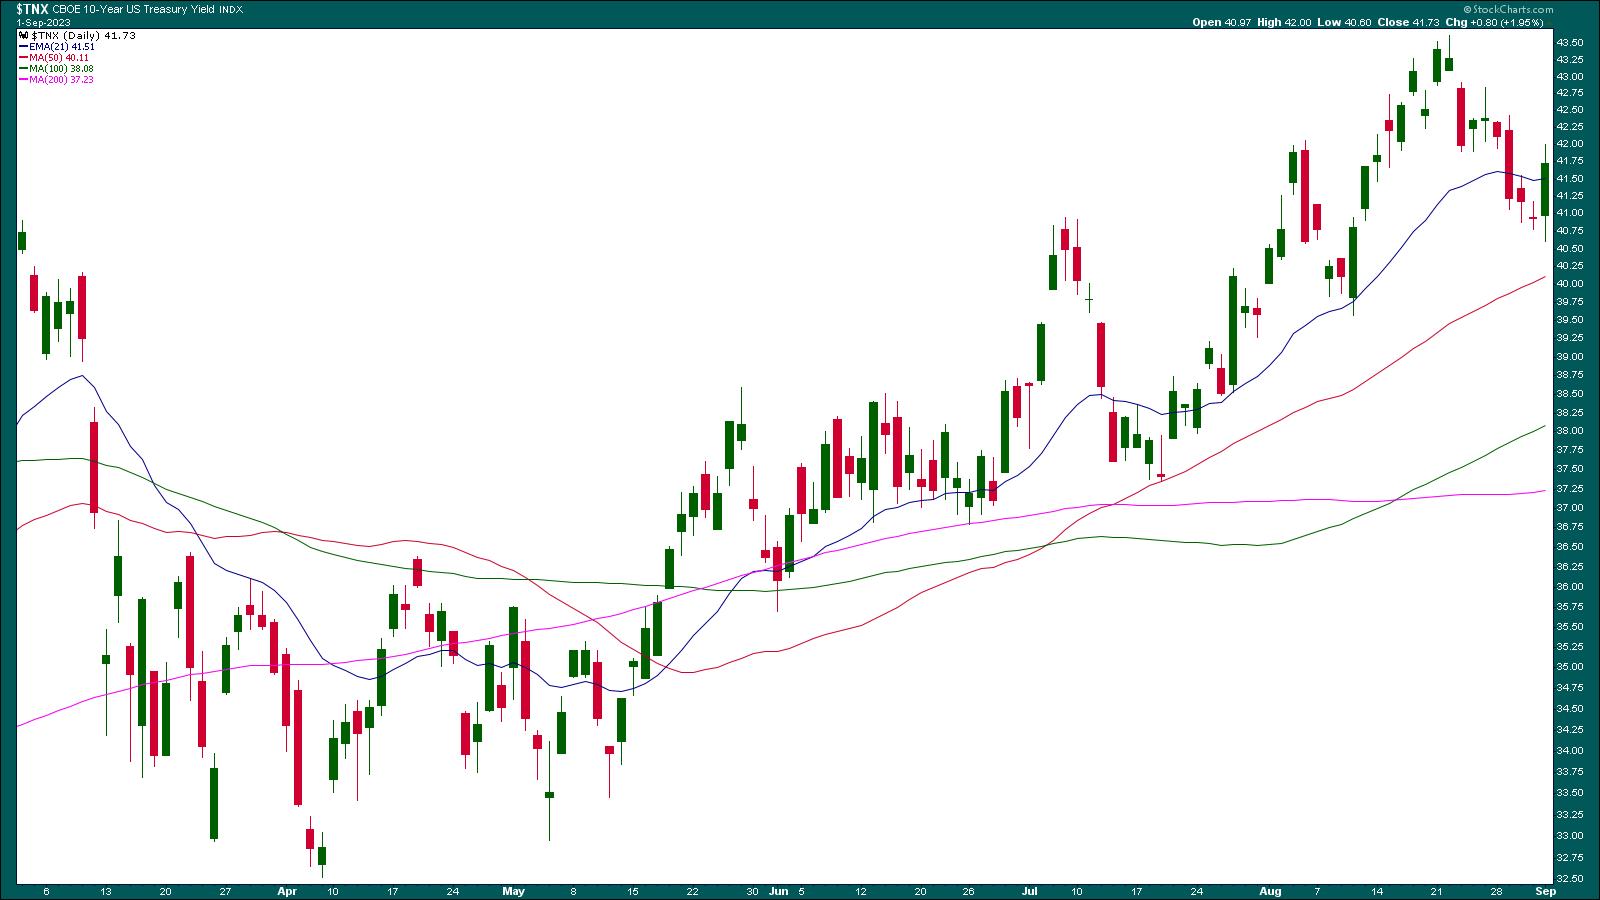
CHART 1: 10-YEAR TREASURY YIELDS ROSE. After the August jobs report, yields rose higher closing above its 21-day EMA. Chart source: StockCharts.com (click on chart for live version). For educational purposes.
Oil prices also rose—the Energy sector was the best-performing sector on Friday. The rise was mainly on the news that Russia and possibly Saudi Arabia would cut their production. Crude oil prices closed above the August highs (see chart below).
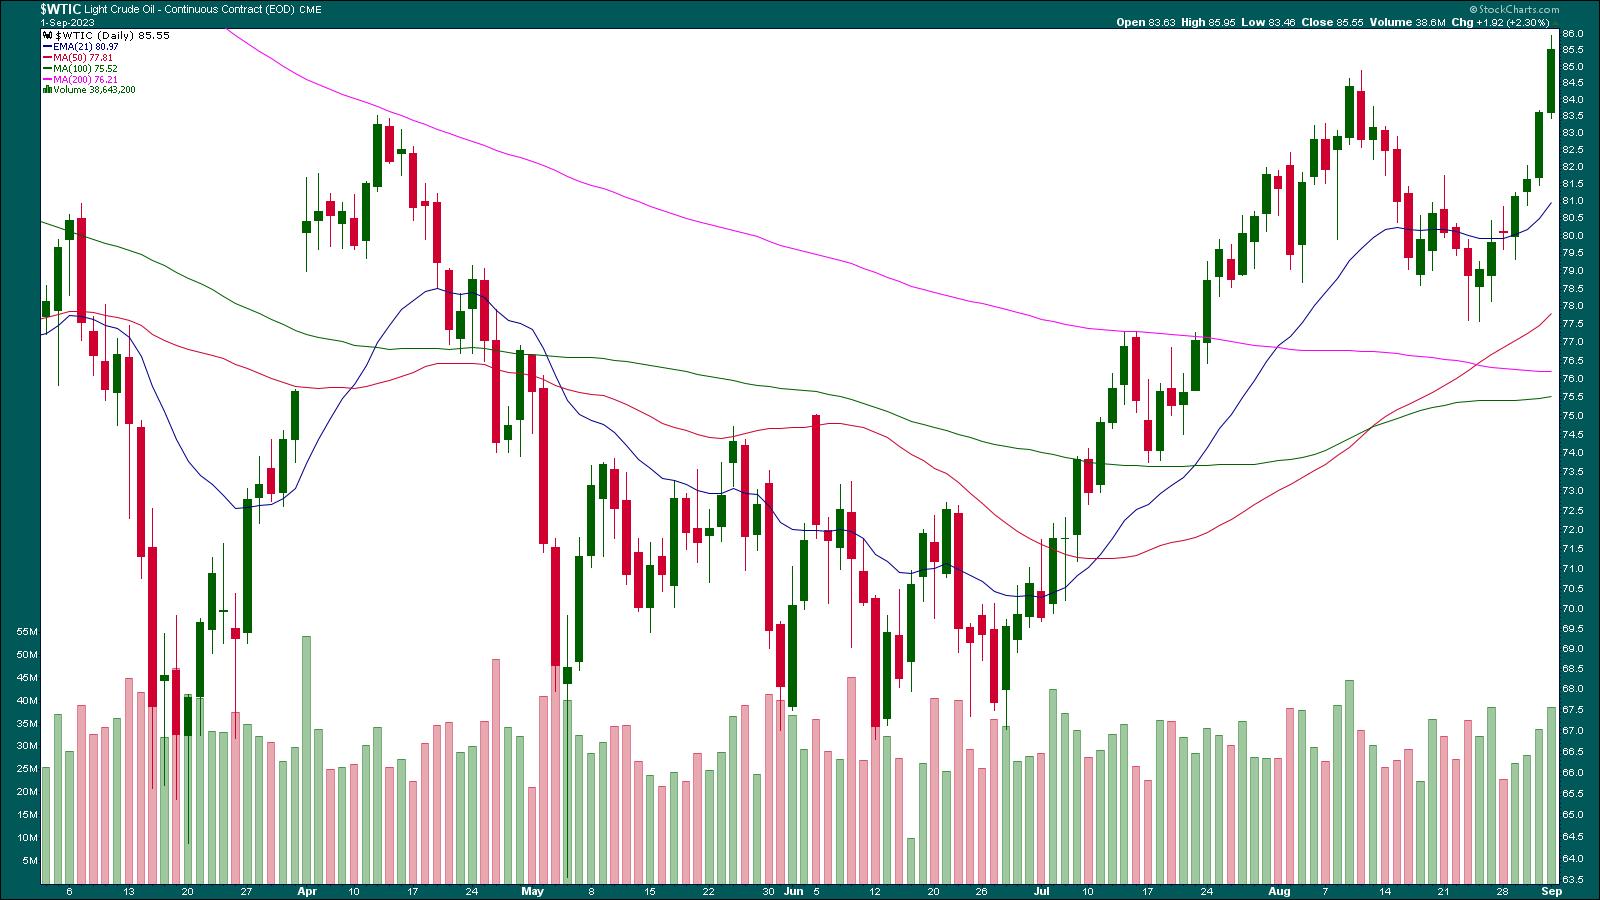
CHART 2: OIL PRICES ROSE. A rise in oil prices could add to inflationary pressures but that won't be determined until the next CPI report. Chart source: StockCharts.com (click on chart for live version). For educational purposes.
The US dollar Index ($USD) has been trending higher and is now close to its May high. It may face resistance at the $104.40 level.
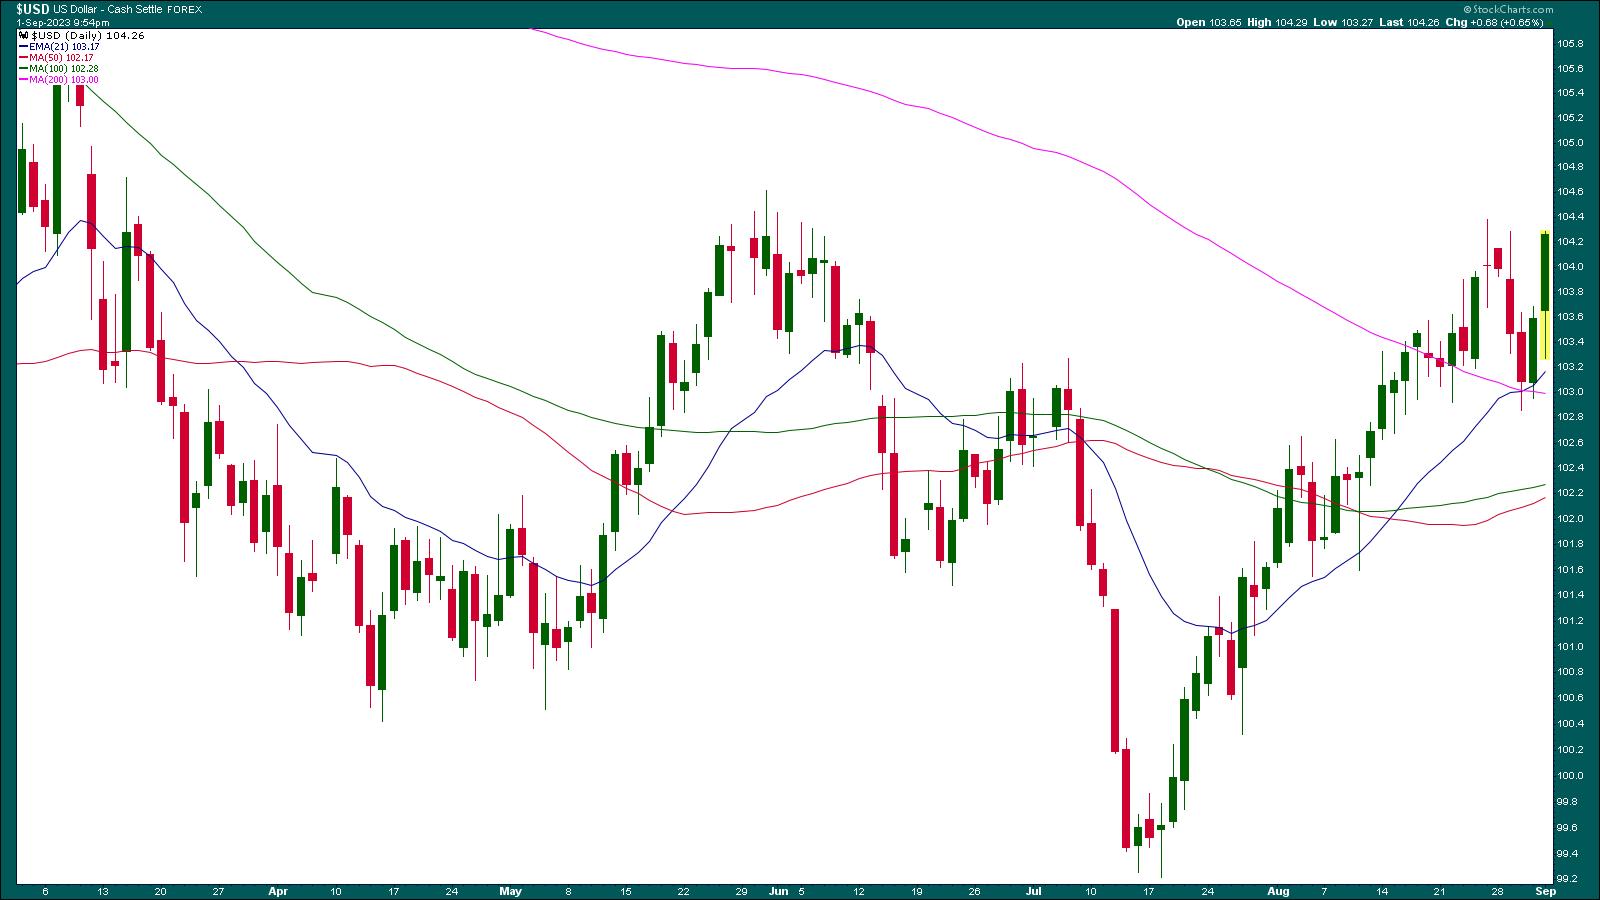
CHART 3: THE US DOLLAR INDEX HAD A STRONG MOVE TO THE UPSIDE. $USD could face resistance at the $104.40 level. Chart source: StockCharts.com (click on chart for live version). For educational purposes.
Equities, on the other hand, were lukewarm and showed little directional movement. However, the broader indexes have managed to hold on to their uptrend.
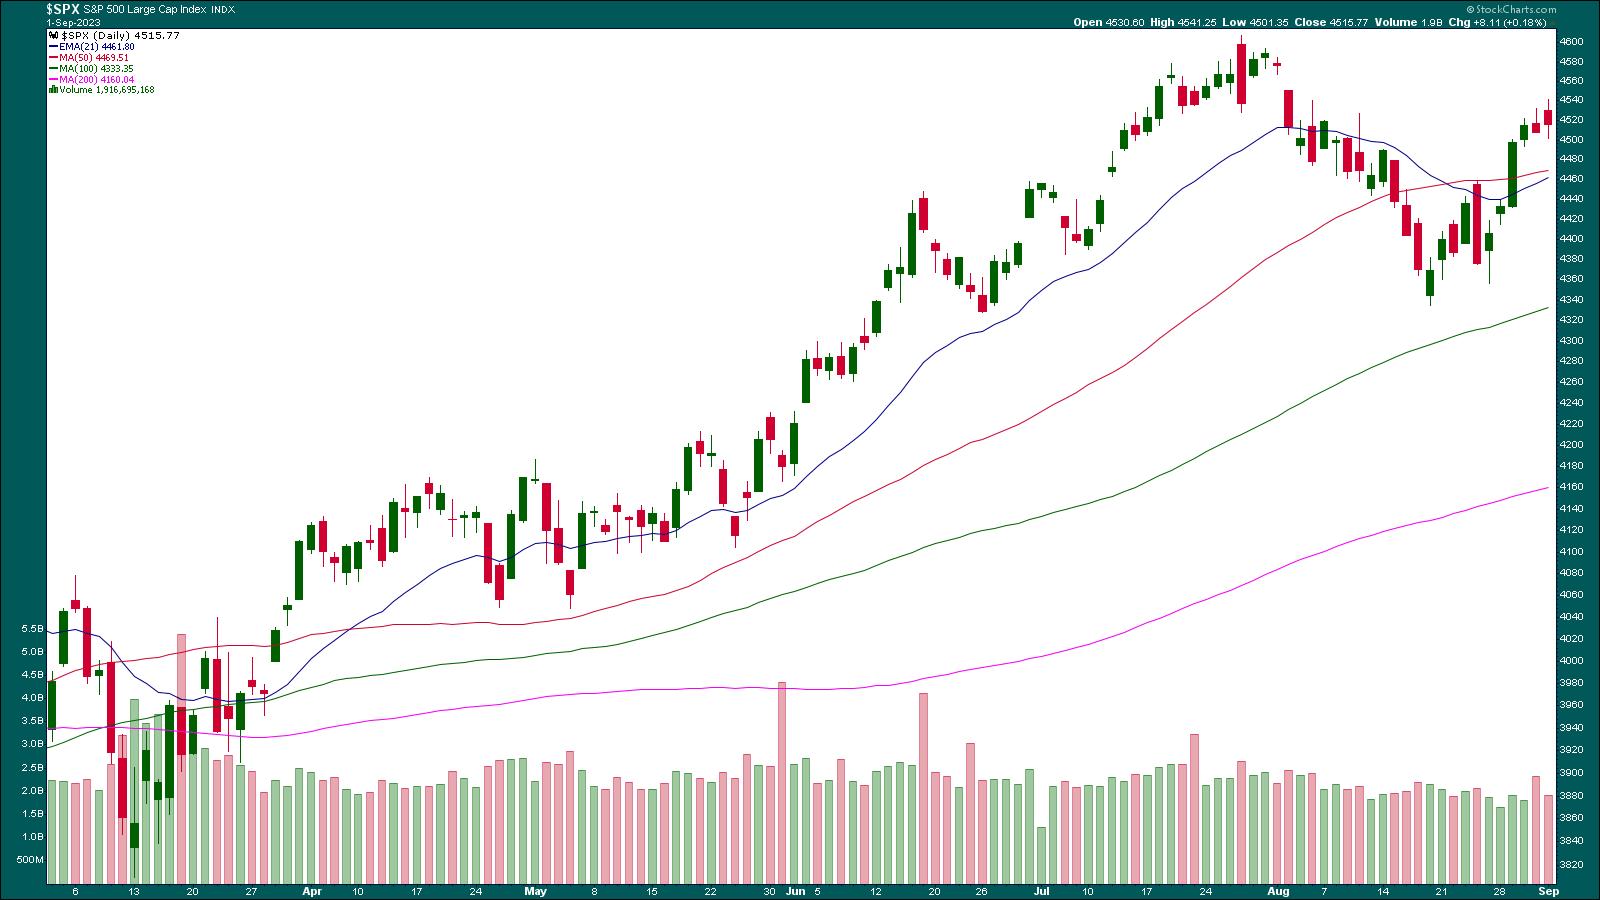
CHART 4: THE S&P 500 INDEX SAW LITTLE MOVEMENT. There's very little directional movement in equities. The S&P 500 index is still in an uptrend, trading above its 50-day moving average. Chart source: StockCharts.com (click on chart for live version). For educational purposes.
Looking at the CME FedWatch Tool, there's a 93% probability that the Fed will hold interest rates steady in their September 2023 meeting. But that probability reduces to 63.9% for the November meeting.
The Big Picture
The macro view looks stable, with the possibility of a recession pretty much diluted. If future data shows a cooling in inflation, there's a chance the Fed may stop raising rates. It almost seems like the market is going through a phase where it's behaving well. It's not making any surprising moves, and maybe investors are not opening new positions before Labor Day weekend.
That said, there's little in terms of economic data next week. It's possible that nothing much might happen till the Fed meets next. But then again, anything unexpected could happen between now and then.
End-of-Week Wrap-Up
US equity indexes mixed; volatility down

- $SPX up 0.18% at 4515.77, $INDU up 0.33% at 34837.71; $COMPQ down 0.02% at 14031.81
- $VIX down 3.54% at 13.09
- Best performing sector for the week: Technology
- Worst performing sector for the week: Utilities
- Top 5 Large Cap SCTR stocks: Super Micro Computer, Inc. (ticker symbol: SMCI); Celsius Holdings Inc. (CELH); NVIDIA Corp. (NVDA); Dell Technologies (DELL); XP Inc. (XP)
On the Radar Next Week
- July factory orders
- August S&P Global Services PMI
- August ISM Services PMI
- July Wholesale Inventories
Disclaimer: This blog is for educational purposes only and should not be construed as financial advice. The ideas and strategies should never be used without first assessing your own personal and financial situation, or without consulting a financial professional.
Happy charting!
