TAKEAWAYS
- The Williams True Seasonal is a unique tool that detects stocks via seasonality patterns
- The Williams True Seasonal indicator differs from other seasonality indicators in that it provides greater accuracy by tweaking the way it uses data
- The main benefit in using the Williams True Seasonal indicator is to identify buy points for stocks that exhibit clear trough-to-peak features
Every trader has preferred ways to find market opportunities and select tradable stocks. Among these methods, which exist in great numbers, are those that concern "seasonality" or market patterns that tend to repeat, according to the calendar.
If you're not entirely familiar with seasonality, it might not make much sense at first with regard to individual stocks. It makes sense with agricultural commodities simply because weather determines planting and harvest seasons. It also makes sense with energy commodities because, again, cold and hot weather tend to influence supply. Broad stock market seasonality might also make sense because holidays affect consumer buying behavior (think Santa Claus Rally).
However, individual stocks can and do have their seasonality patterns. What drives them? Anything from earnings season and consumer spending patterns to inventory levels, interest rates, and political events.
How Can I Detect Seasonality Patterns for Individual Stocks?
Finding seasonality-based trading opportunities on an individual stock level can be tricky. There aren't many indicators that can do this. This "gap" is what the Williams True Seasonal indicator aims to fill—basically, detecting seasonal patterns on the scale of individual securities.
What is the ‘Williams True Seasonal' Indicator?
Developed by Larry Williams in 1973, the Williams True Seasonal is a technical indicator designed to identify seasonal trends in the price of a security. As with most seasonality indicators, it measures the difference between a security's price and its average price over a specific period.
What Makes the Williams True Seasonal Different from Other Indicators?
The Williams True Seasonal differs from other seasonal indicators in its use of data. More specifically, it avoids using out-of-sample data. For example, if you wish to determine the seasonal data for 2010, only the data up to 2010 would be employed.
Other seasonal indicators might use post-2010, which is a bit "off" considering that it's using future data to calculate past seasonality. By limiting its data, the Williams True Seasonal might provide a more precise read on a stock's seasonality.
Which time frame works best for the Williams True Seasonal? It works best for weekly and daily charts. That's how Larry Williams designed it.
How to Use the Williams True Seasonal to Identify Tradable Stocks
Let's take a look at the weekly SPDR Gold Shares ETF (GLD) below.
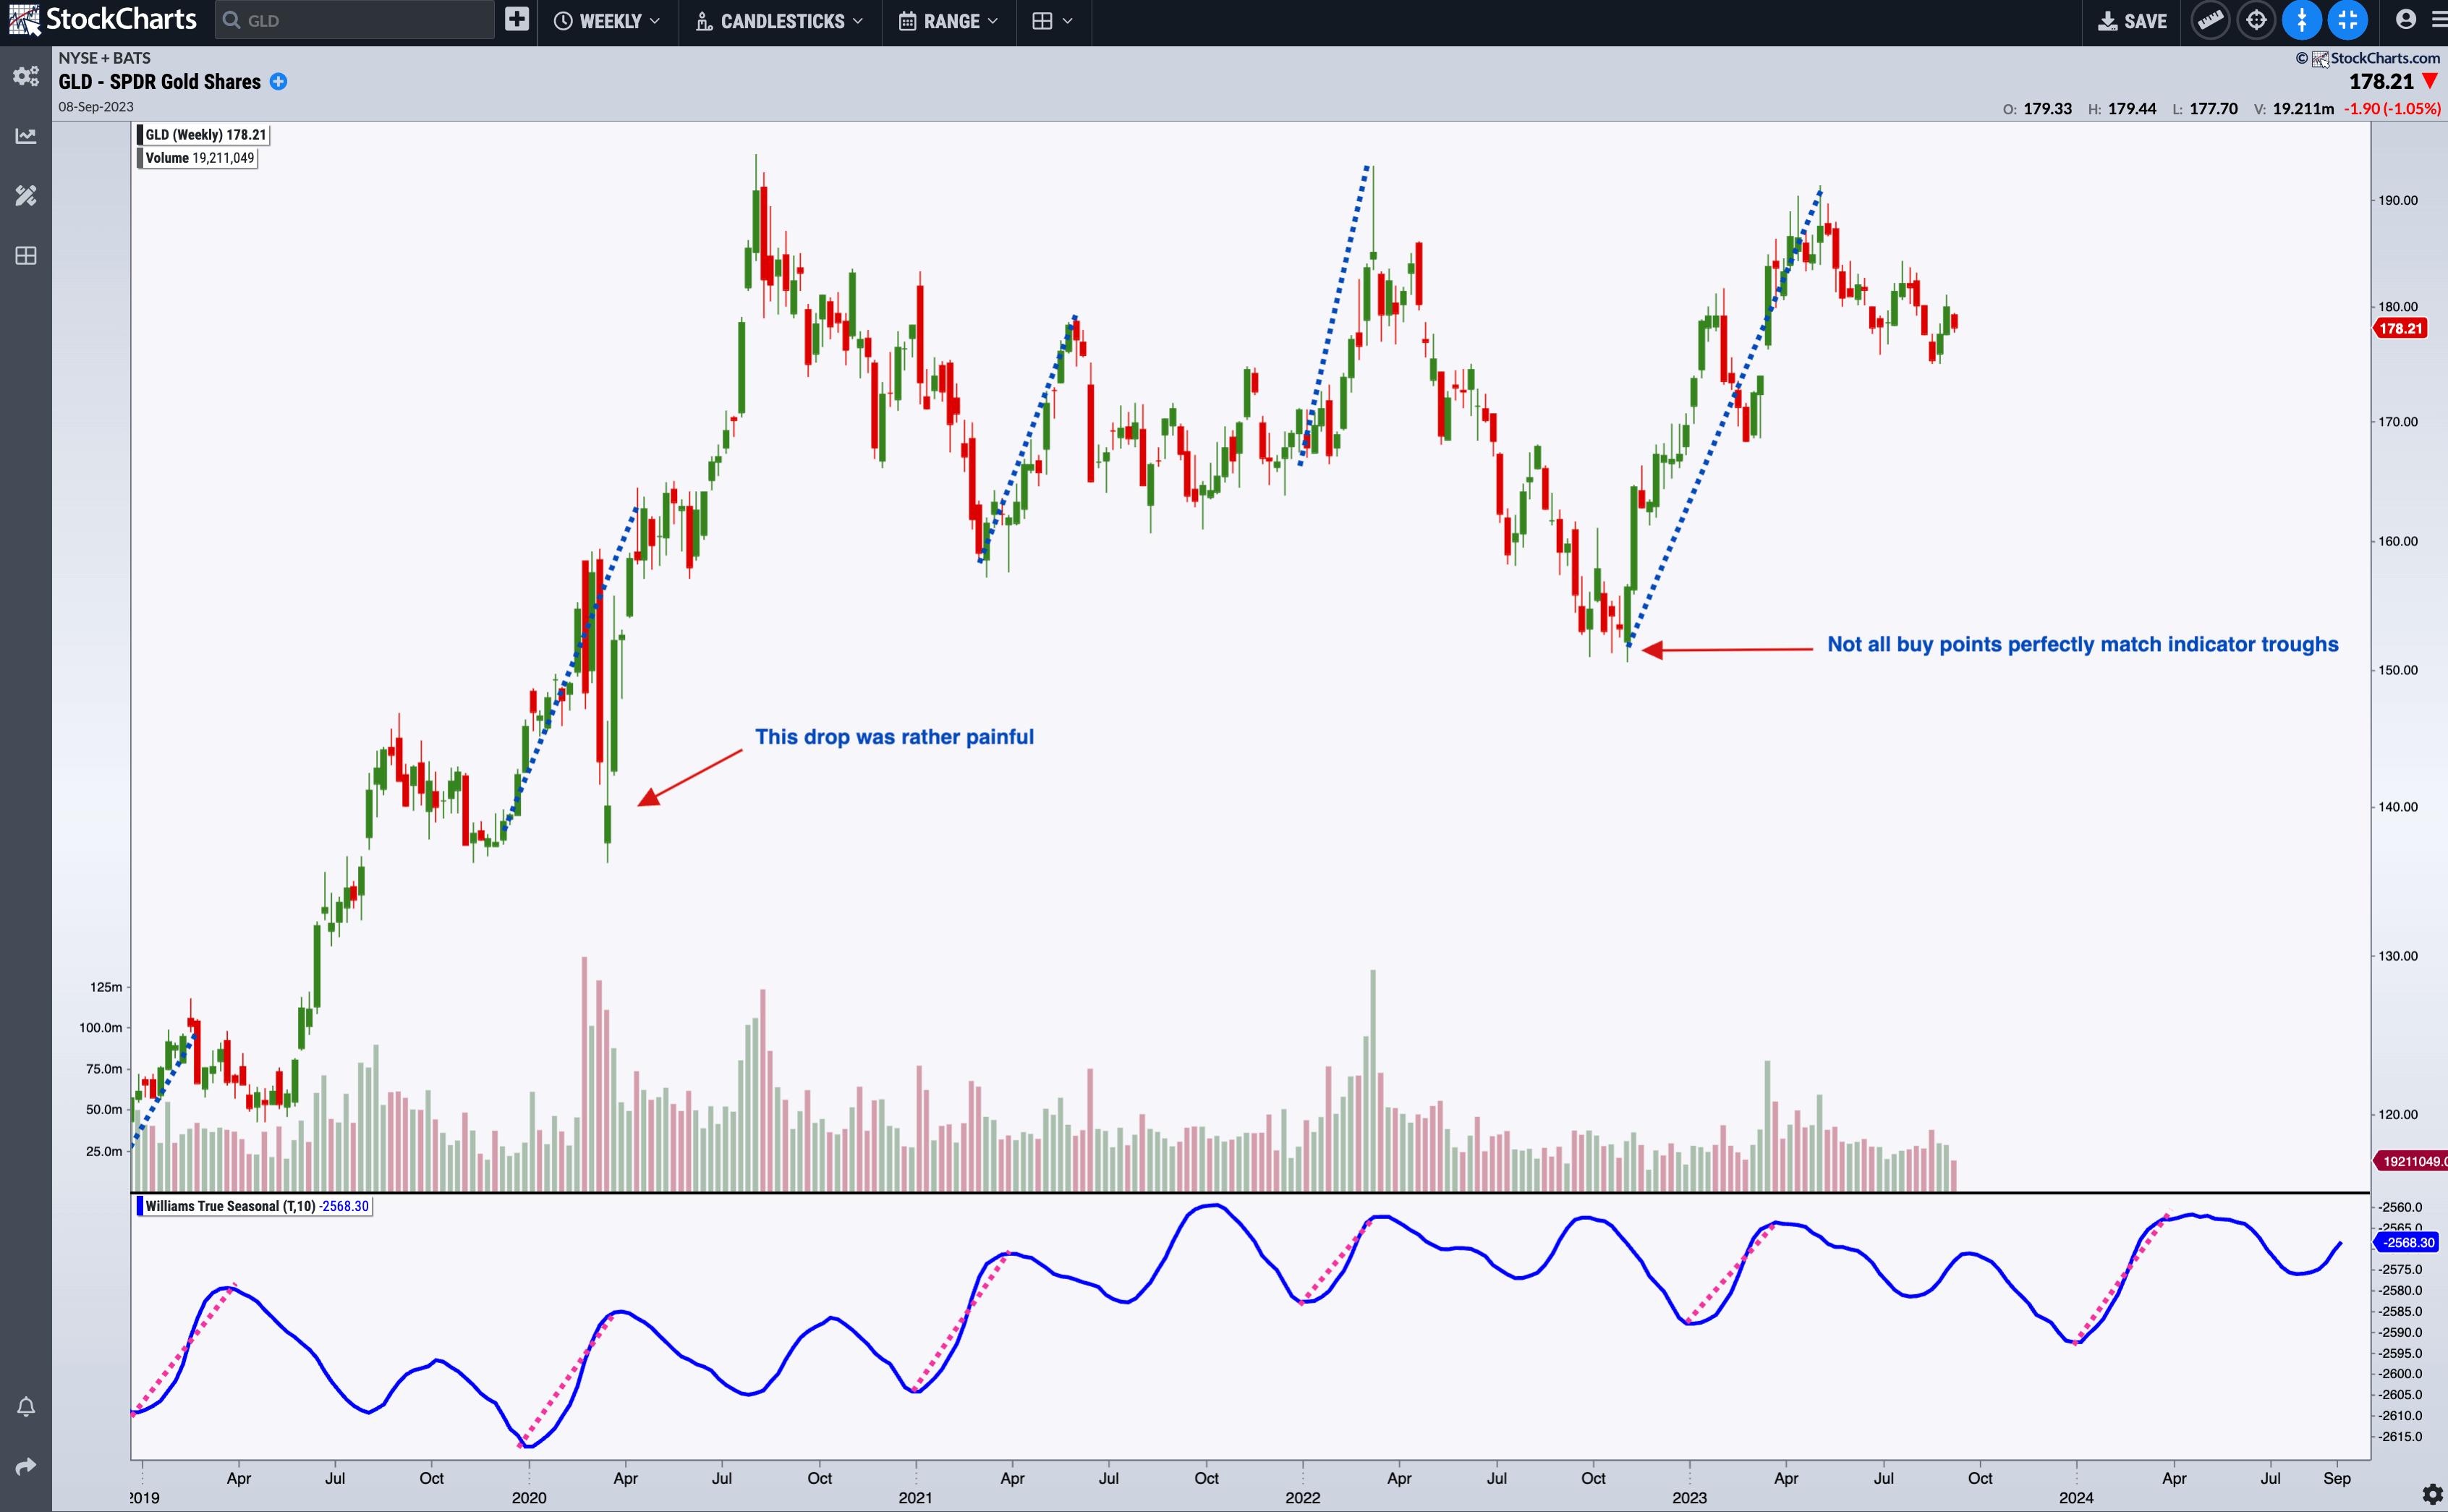
CHART 1: WEEKLY CHART OF GLD. Contrary to popular wisdom, the summer months may not be the best months to load up on gold.Chart source: StockChartsACP. For educational purposes.
 The Williams True Seasonal indicator is available in StockChartsACP as a plug-in.
Once you've installed it, scroll down the available indicators list (it's below the standard indicators), select Williams True Seasonal, and you'll be ready to apply this indicator to your analysis.
Looking closely at the Williams True Seasonal indicator, note the following:
- GLD tends to rise before the beginning of the year and peaks in April.
- Note how the pink dashed line highlighting this peak-to-trough in the Williams True Seasonal correlates with the blue dashed line on GLD's price chart.
- Note that the April peaks look differently depending on whether GLD is trending or not (and this can affect the way you trade GLD).
- According to this seasonal pattern, it would be wise to buy gold toward the end of the year; if the market is not trending upward, it might even be a wise decision to sell around April. Come this December, will the end of 2023 offer another compelling buy point?
- Still, you have to be flexible, as not all buy (or sell) points match perfectly with the indicator (although it comes pretty close to it), and some volatile moves, such as the one we saw in 2020, can occur.
Next, let's look at a weekly chart of IBM.
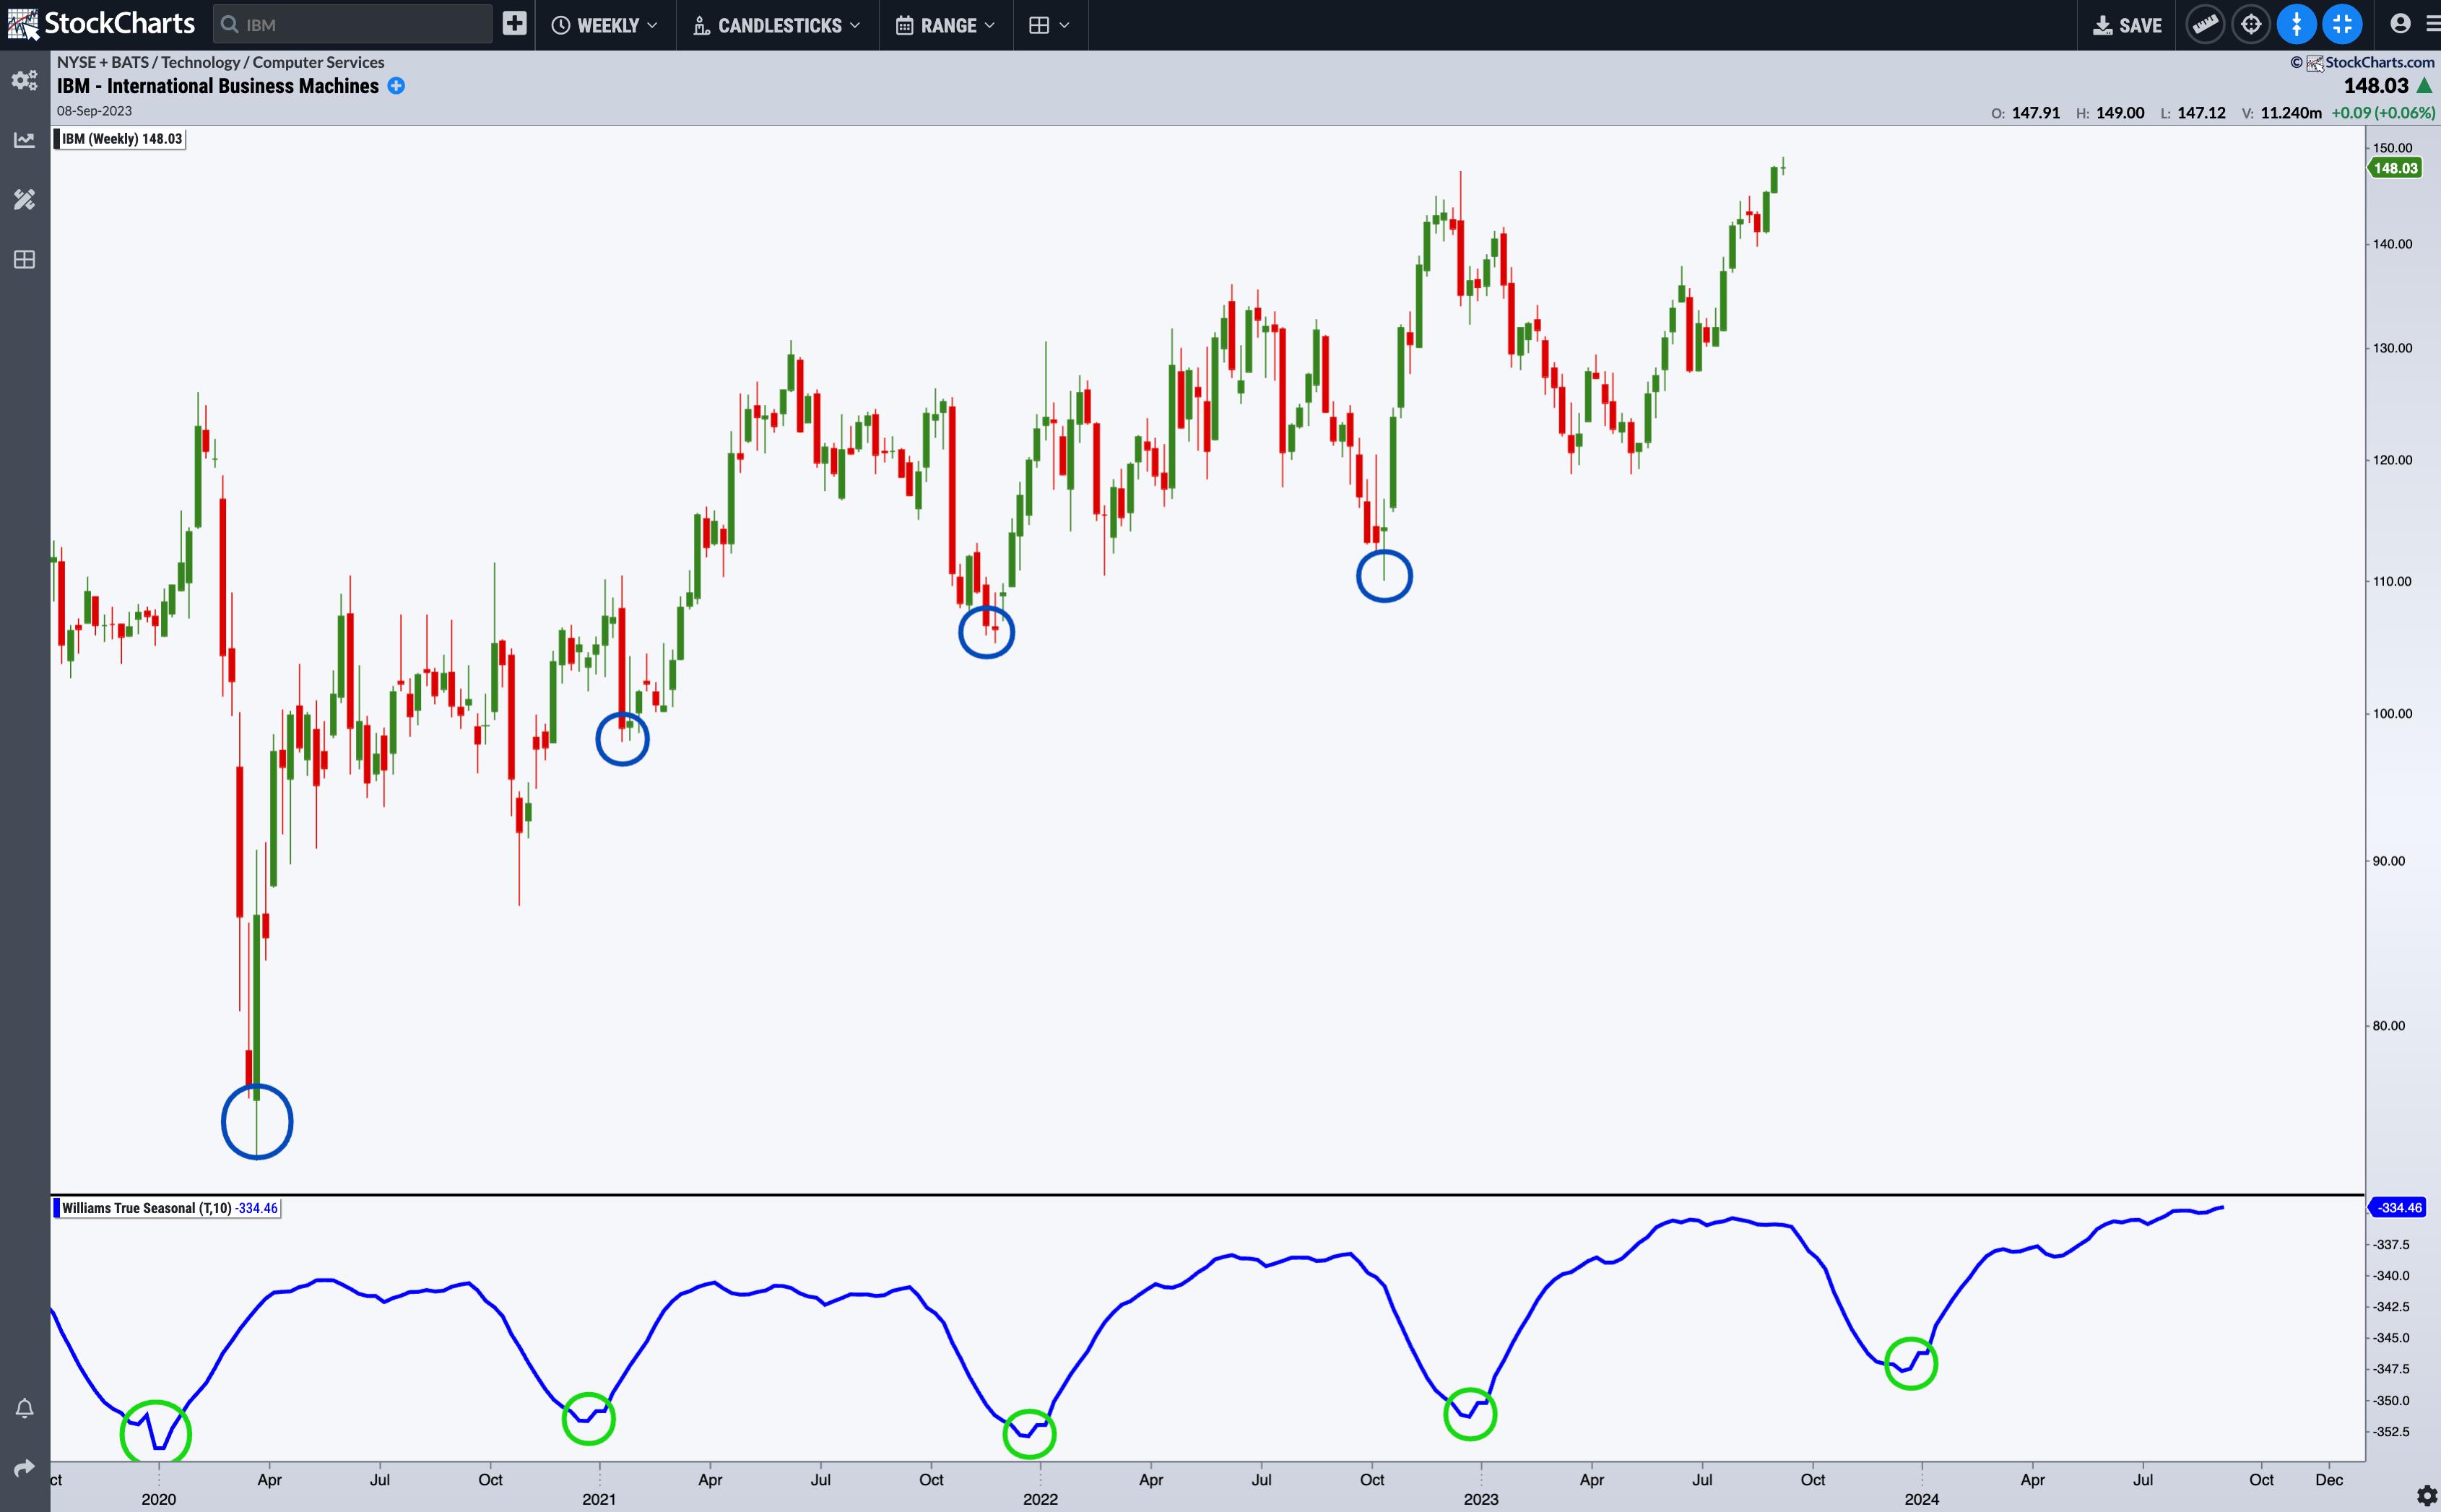
CHART 2: WEEKLY CHART OF IBM. Seasonal demand for IBM products may correspond with annual business spending toward the first of the year.Chart source: StockChartsACP. For educational purposes.
IBM makes for an ideal case because its seasonal peaks and troughs are so well-defined. IBM's buy point is toward the beginning of the year. In 2020, the big COVID Crash may have offset this seasonal trend, but it remained intact despite the uncertainties that pervaded global markets and economies. The Williams True Seasonal projects another buy point in 2024. That could mean IBM's share price might dip before resuming this seasonal trend.
Now, let's look at the Williams True Seasonal applied to daily charts.
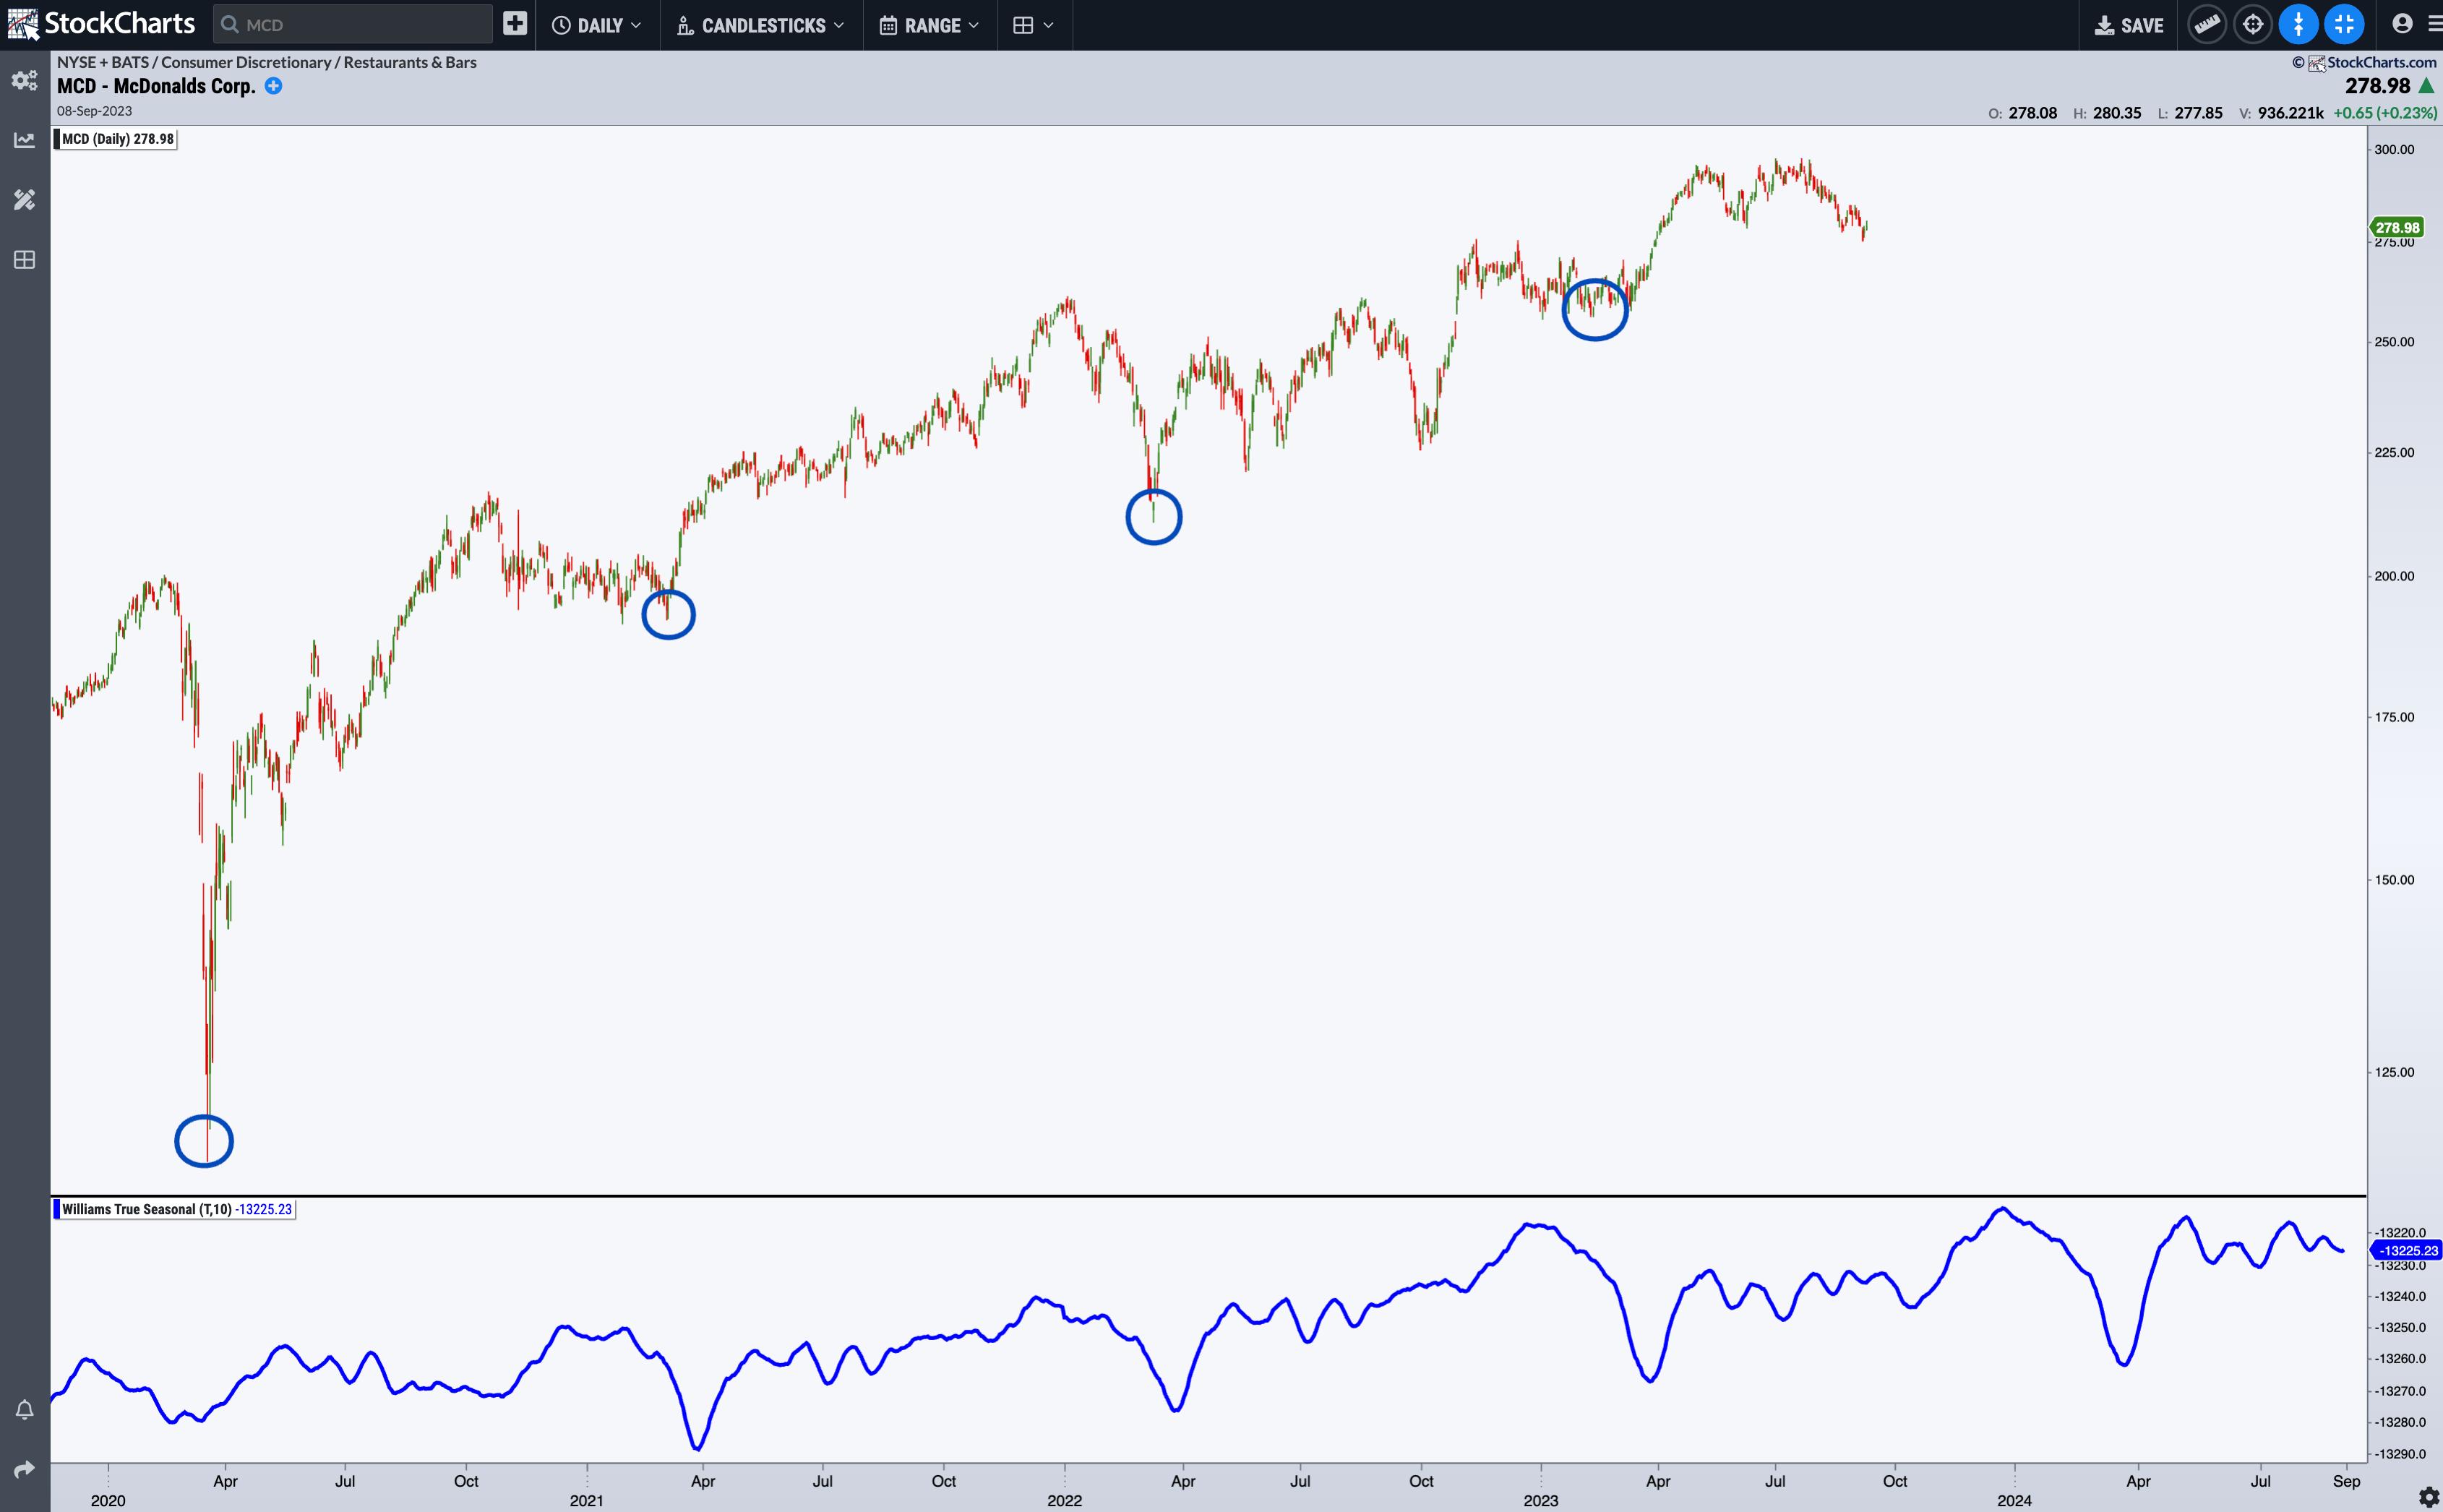
CHART 3: DAILY CHART OF MCDONALDS (MCD). Do the troughs in the Williams True Seasonal indicator signal more burger cravings and spending or investment at the end of the first quarter of the year?Chart source: StockChartsACP. For educational purposes.
Since the decline in 2020, McDonald's (MCD) began exhibiting seasonal buy points in late March. The dips in the Williams True Seasonal indicator are quite pronounced, and although the market action corresponding to these buy points varies slightly, MCD has generally been on an uptrend, and the next buy point signal may take place again in late March, should the seasonal trend continue.
The Bottom Line
The Williams True Seasonal is not so much a timing indicator as it is an early warning signal and a stock selection tool. Trading the markets with a clear view of seasonality patterns can give you a significant advantage. While the Williams True Seasonal is a potent tool, combining it with other indicators he developed, such as those for timing markets, can help sharpen your approach and trading performance.
Disclaimer: This blog is for educational purposes only and should not be construed as financial advice. The ideas and strategies should never be used without first assessing your own personal and financial situation, or without consulting a financial professional.