TAKEAWAYS
- September is usually a weak month in the stock market and this time it may be no different
- In spite of the selloff the broader equity indexes are still trending higher
- Rising oil prices and the US dollar may put some pressure on inflation

"September is when leaves and stocks tend to fall; On Wall Street, it's the worst month of all."— Stock Trader's Almanac.
Why is September considered to be the worst month for stock market performance? There's no right answer, but the general belief is that, because most people's summer vacation ends and it's back to school for kids, investors are inclined to sell their positions to lock in some gains. September also marks the end of the third quarter, when mutual fund managers do their end-of-quarter restructuring.
In addition to these factors, we've seen shares of Apple, Inc. (ticker symbol: AAPL) fall sharply after China's restrictions on iPhones. NVIDIA (ticker symbol: NVDA) has also seen its share price fall. Other mega-cap stocks, such as Tesla (TSLA), Microsoft (MSFT), and Meta Platforms (META), are also trading off their highs. The broader indexes have also pulled back from late July to early August.
So far, the market is acting as it should in September. If you look at the weekly chart of the S&P 500 (see below), the trend still looks up. The S&P 500 ($SPX) has continued to trade above its 21-week exponential moving average (EMA), which could act as a support level if the index continues pulling back.
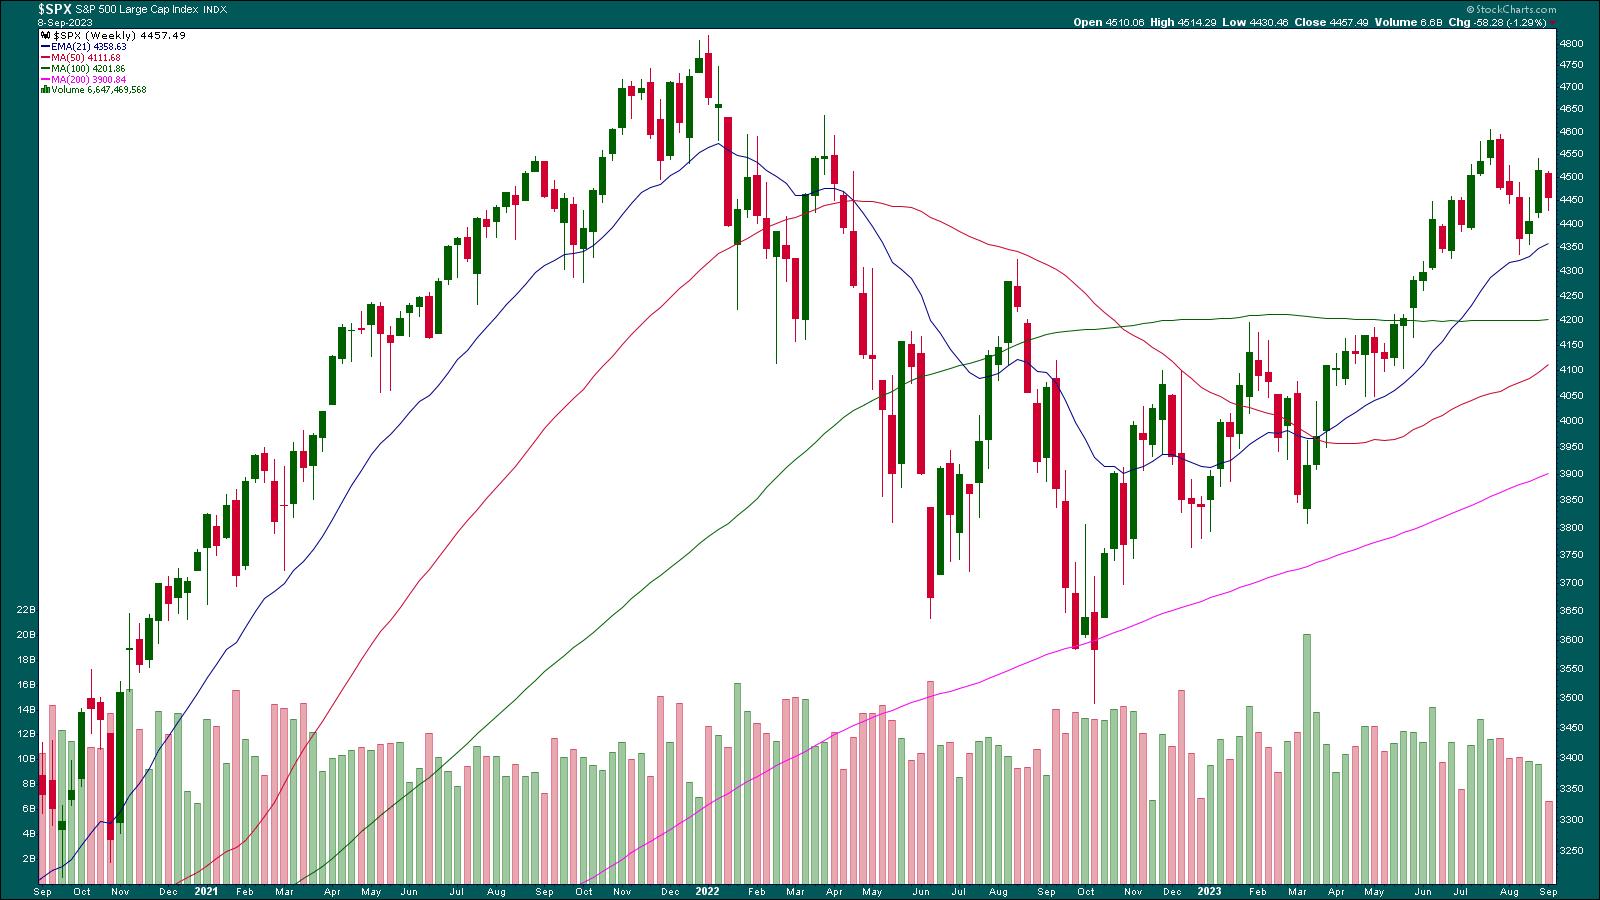
CHART 1: WEEKLY CHART OF S&P 500 INDEX. The index is still trending higher, trading above its 21-week EMA.Chart source: StockCharts.com (click on chart for live version). For educational purposes.
If you look at the daily chart of the S&P 500 below, since September 1, the index has been trending lower. The 21-day EMA is acting as a resistance level, but there needs to be a few more bars lower than the EMA to say the S&P 500 is correcting. A couple of days earlier, it seemed like the EMA was a support level.
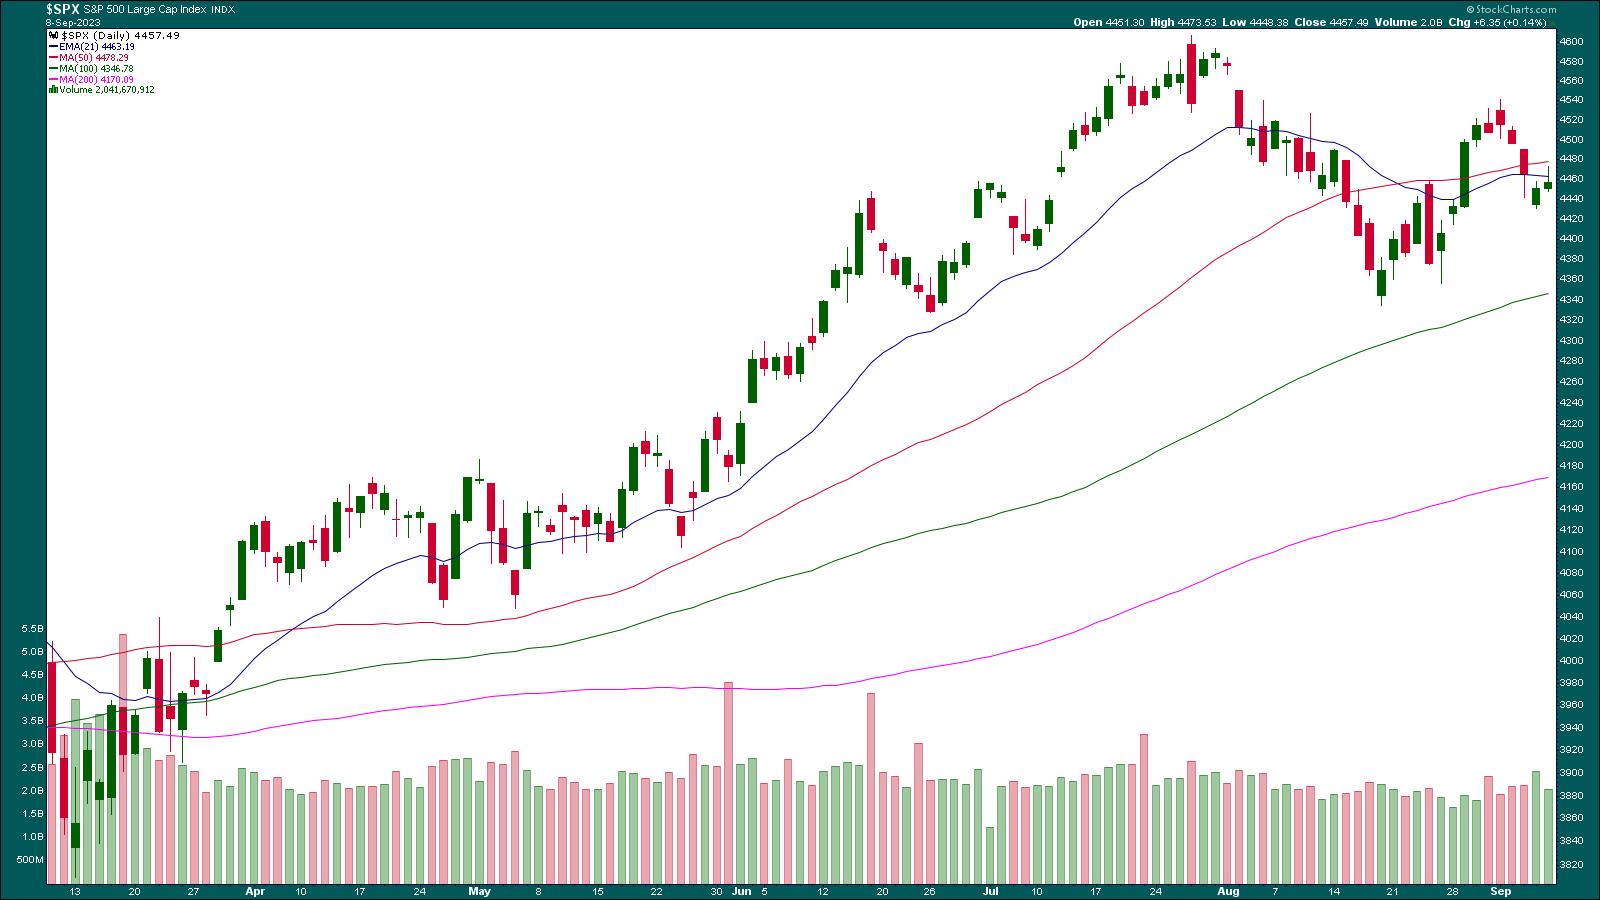
CHART 2: DAILY CHART OF S&P 500. The 21-day EMA is now acting as a resistance level. The next support level is the 100-day moving average.Chart source: StockCharts.com (click chart for live version). For educational purposes.
How the index reacts to the 21-day EMA can give an indication of whether the index is likely to fall further. If the index fails to trade above its 21-day EMA, the next support on the daily chart is the 100-day simple moving average.
Investors are still concerned about interest rates. The uptick in the ISM numbers and a drop in initial jobless claims suggest the economy is still strong. This suggests that the Fed could still raise interest rates this year. Most likely, the interest rate hike won't occur in the September meeting—the CME FedWatch Tool shows a 93% probability that interest rates will be unchanged. The probability of keeping interest rates steady in the November meeting drops to 56%. The Consumer Price Index (CPI) and Producer Price Index (PPI) for August will be released next week; it will be interesting to see if interest rate hikes have weaved into the economy.
One factor that could play into the inflation picture is the price of crude oil, which continues to increase. Crude oil is trading at around $87 per barrel. The last time oil was trading at this level was in November 2022. Besides tighter supply conditions, the rise in the US dollar could have pushed oil prices higher. The big question is if the price of crude oil will hit $100. It could, but if it moves toward the $120–$130 range, that could create demand pressure.
Final Thoughts
So, a few things to keep an eye on next week. Let's see if September plays out like it typically does. And after September comes the month that's known for its unpredictability.
End-of-Week Wrap-Up
US equity indexes up; volatility down
- $SPX up 0.14% at 4457.58, $INDU up 0.22% at 34577.28; $COMPQ up 0.09% at 13761.53
- $VIX down 3.47% at 13.90
- Best performing sector for the week: Energy
- Worst performing sector for the week: Industrials
- Top 5 Large Cap SCTR stocks: Super Micro Computer (SMCI); Celsius Holdings (CELH); Dell Technologies (DELL); Eli Lilly (LLY); XP Inc. (XP)
On the Radar Next Week
- August CPI
- August retail sales
- PPI
- September Michigan Consumer Sentiment (Prel)

Disclaimer: This blog is for educational purposes only and should not be construed as financial advice. The ideas and strategies should never be used without first assessing your own personal and financial situation, or without consulting a financial professional.
Happy charting!
