TAKEAWAYS
- Like a swiss army knife, the Ichimoku Kinko Hyo is a multi-purpose indicator that can be used to shape your trading setups and decisions
- The Chikou Span, with its 26-day look-back, can be used to confirm market sentiment and identify potential trend reversals
- Even as a retroactive feature, the Chikou Span can offer early trading signals, sometimes even preceding other indicators

The Ichimoku Kinko Hyo (or Ichimoku for short) is like a Swiss army knife of an indicator, designed for everything from projecting support and resistance to identifying trade signals. It has five key components that should be combined to analyze current price action while setting up future trades.
What makes the Ichimoku unique among indicators is its 26-day look-forward and look-back feature. It's sort of like driving: you can't just move based on what's in front of you, you have to scan your sides to see what's happening now, as well as look behind you to see what it means for your planned maneuvers.
This article examines the 26-period look-back: the Chikou Span, or the "Lagging" Span.
Two Reasons to Look Back 26 Days
If you can see what's happening now and have a potential setup for the future, why look back? It seems a bit awkward, but there must be some rationale beyond the Chikou Span's function.
Well, there are two:
- First, to measure (more like "confirm") market sentiment.
- Second, to signal potential trend reversals, sometimes early on.
In this way, you can look at current and future setups with the confidence of seeing some form of confirmation based on past price action. Let's consider the first reason: measuring market sentiment.
Measuring Market Sentiment with the Chikou Span
Take a look at the daily chart of Apple, Inc (AAPL) below:
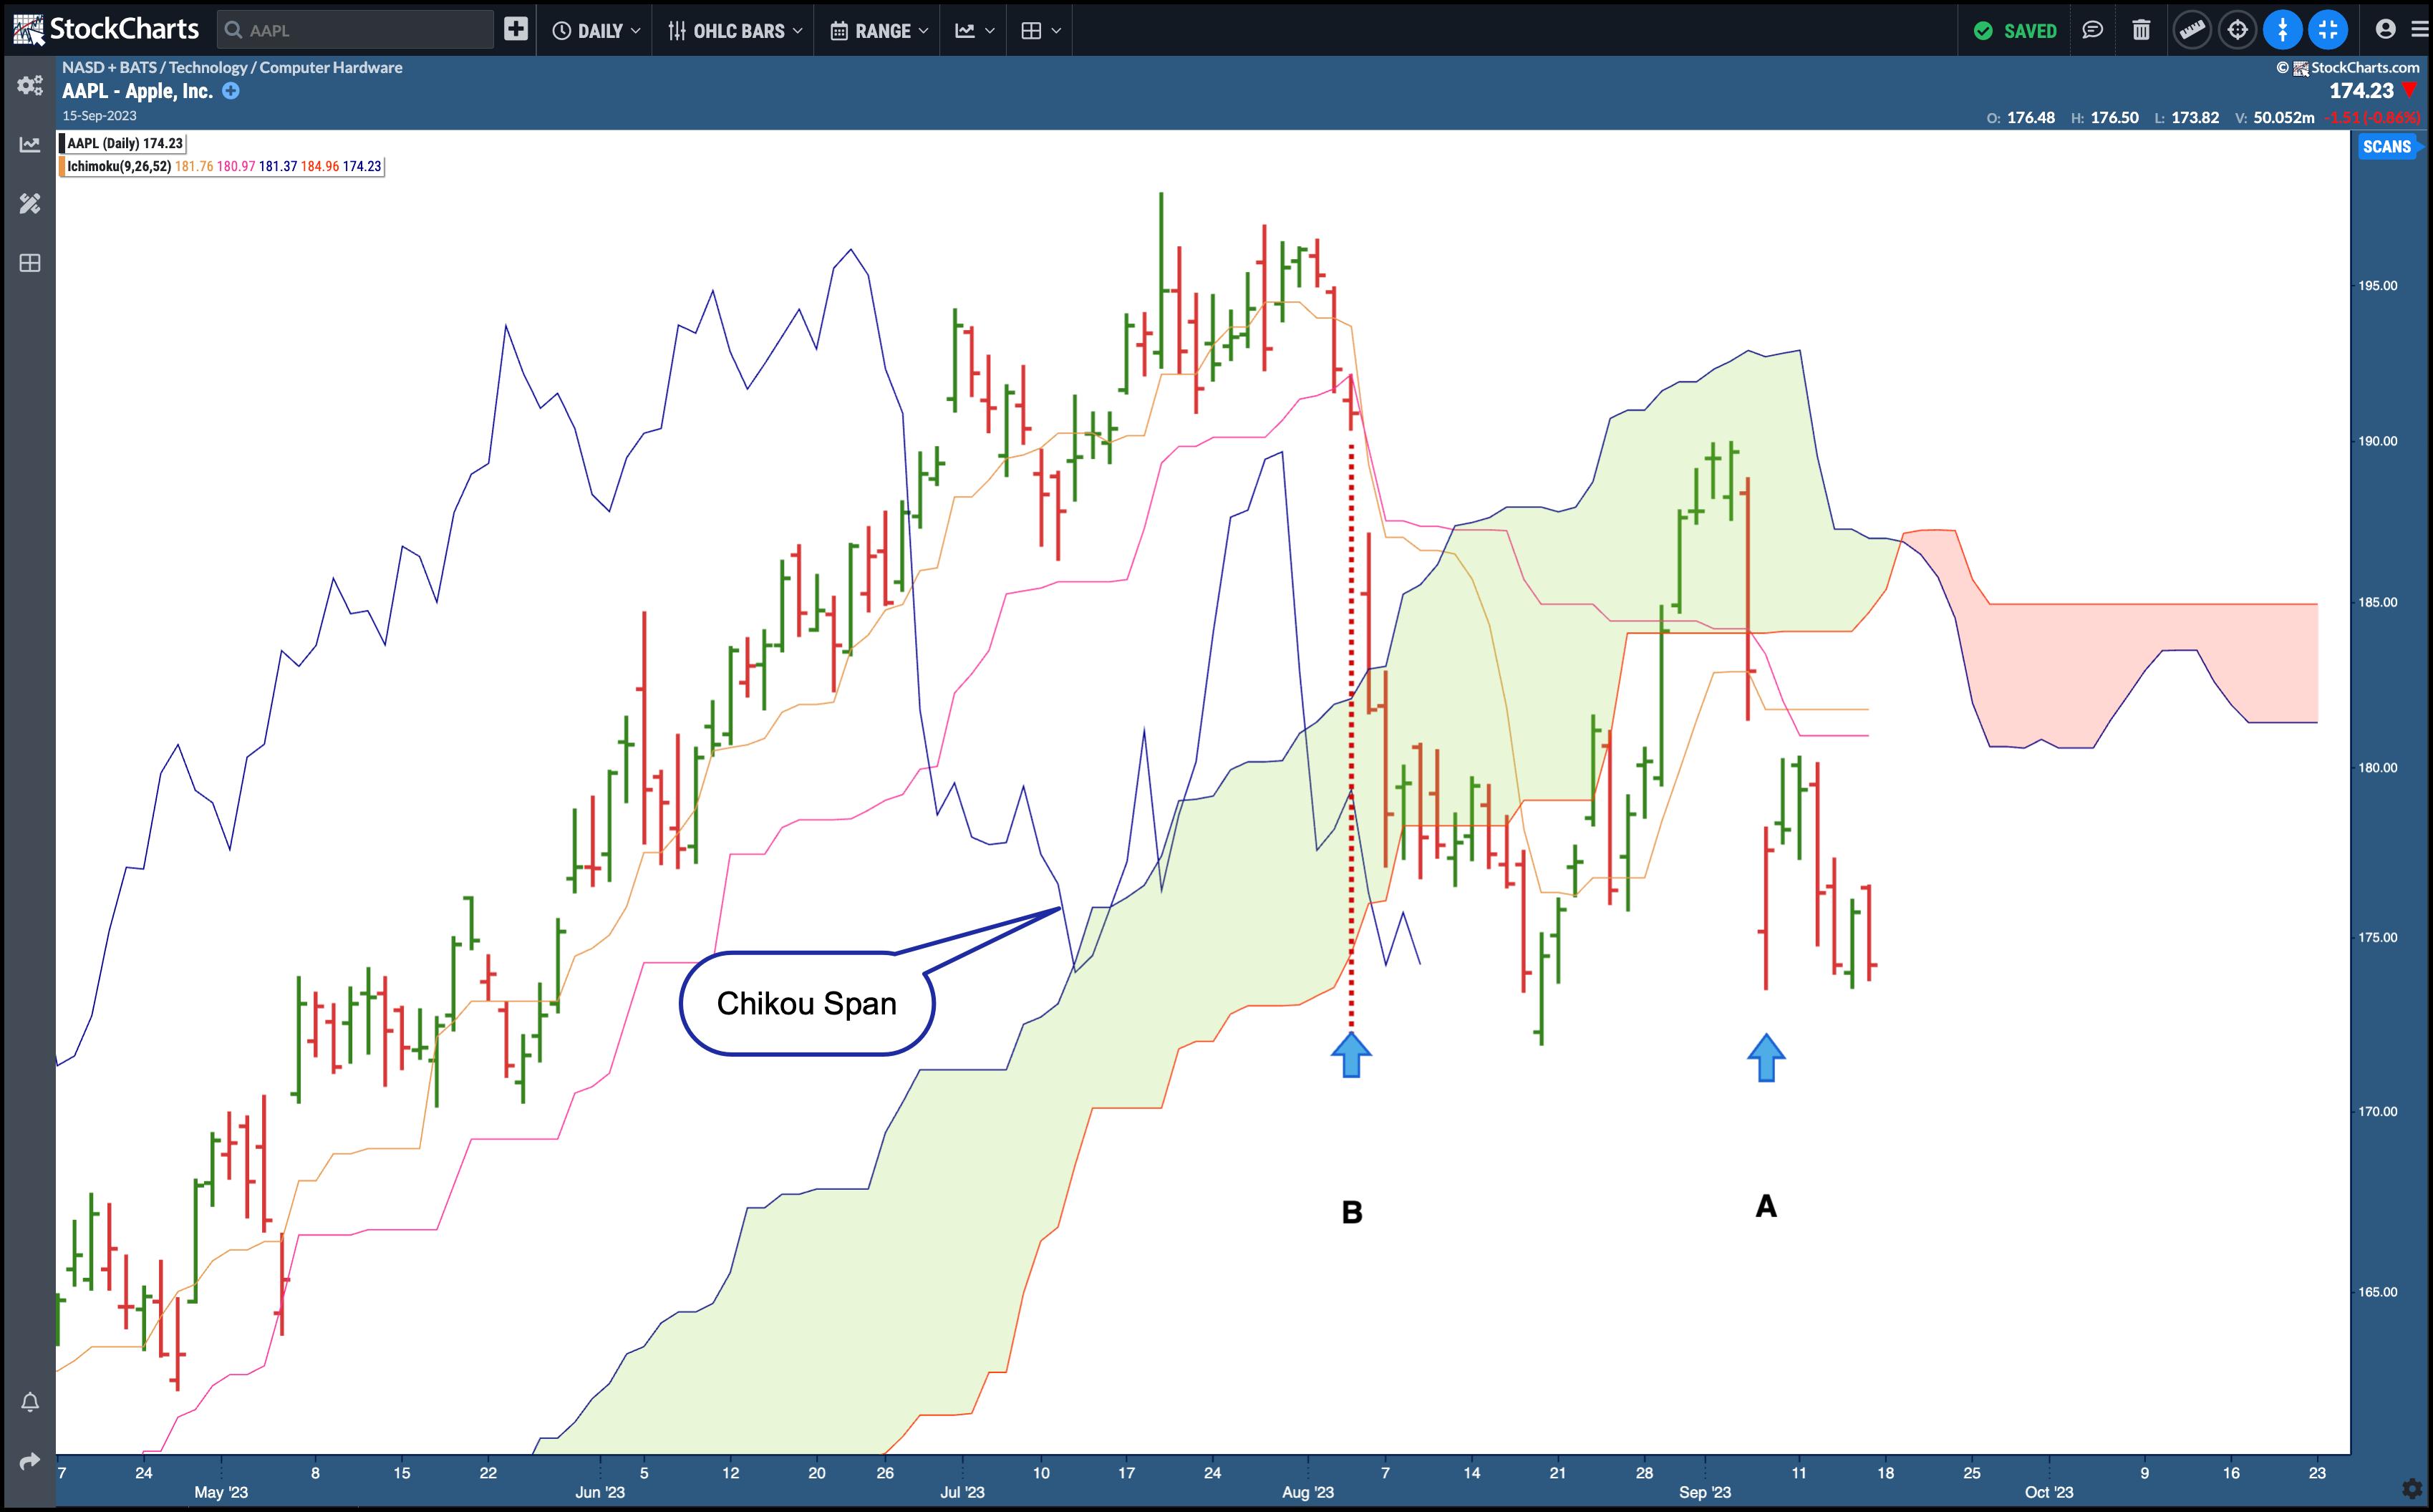
CHART 1. APPLE INC (AAPL) AND ICHIMOKU INDICATOR WITH ALL COMPONENTS BUT THE CHIKOU SPAN DULLED OUT. This chart shows that the Chikou Span is 26 days (or periods) behind current prices.Chart source: StockChartsACP. For educational purposes.
- The Chikou Span is displayed in blue.
- The arrow labeled A is the candle of focus.
- The arrow labeled B marks where the Chikou Span was 26 days prior.
Now, note that in B, the Chikou Span was well below the price 26 days prior. This indicates that sellers (or the proverbial "bears") controlled the market. And, of course, you know this because prices have fallen from where they stood 26 days ago.
So what's the value in showing and confirming what you already know? The value of the Chikou Span is in the moment of its crossover and can be used to identify trend reversals.
Using the Chikou Span to Identify Potential Trend Reversals
Let's look at the same chart, but go back several periods.
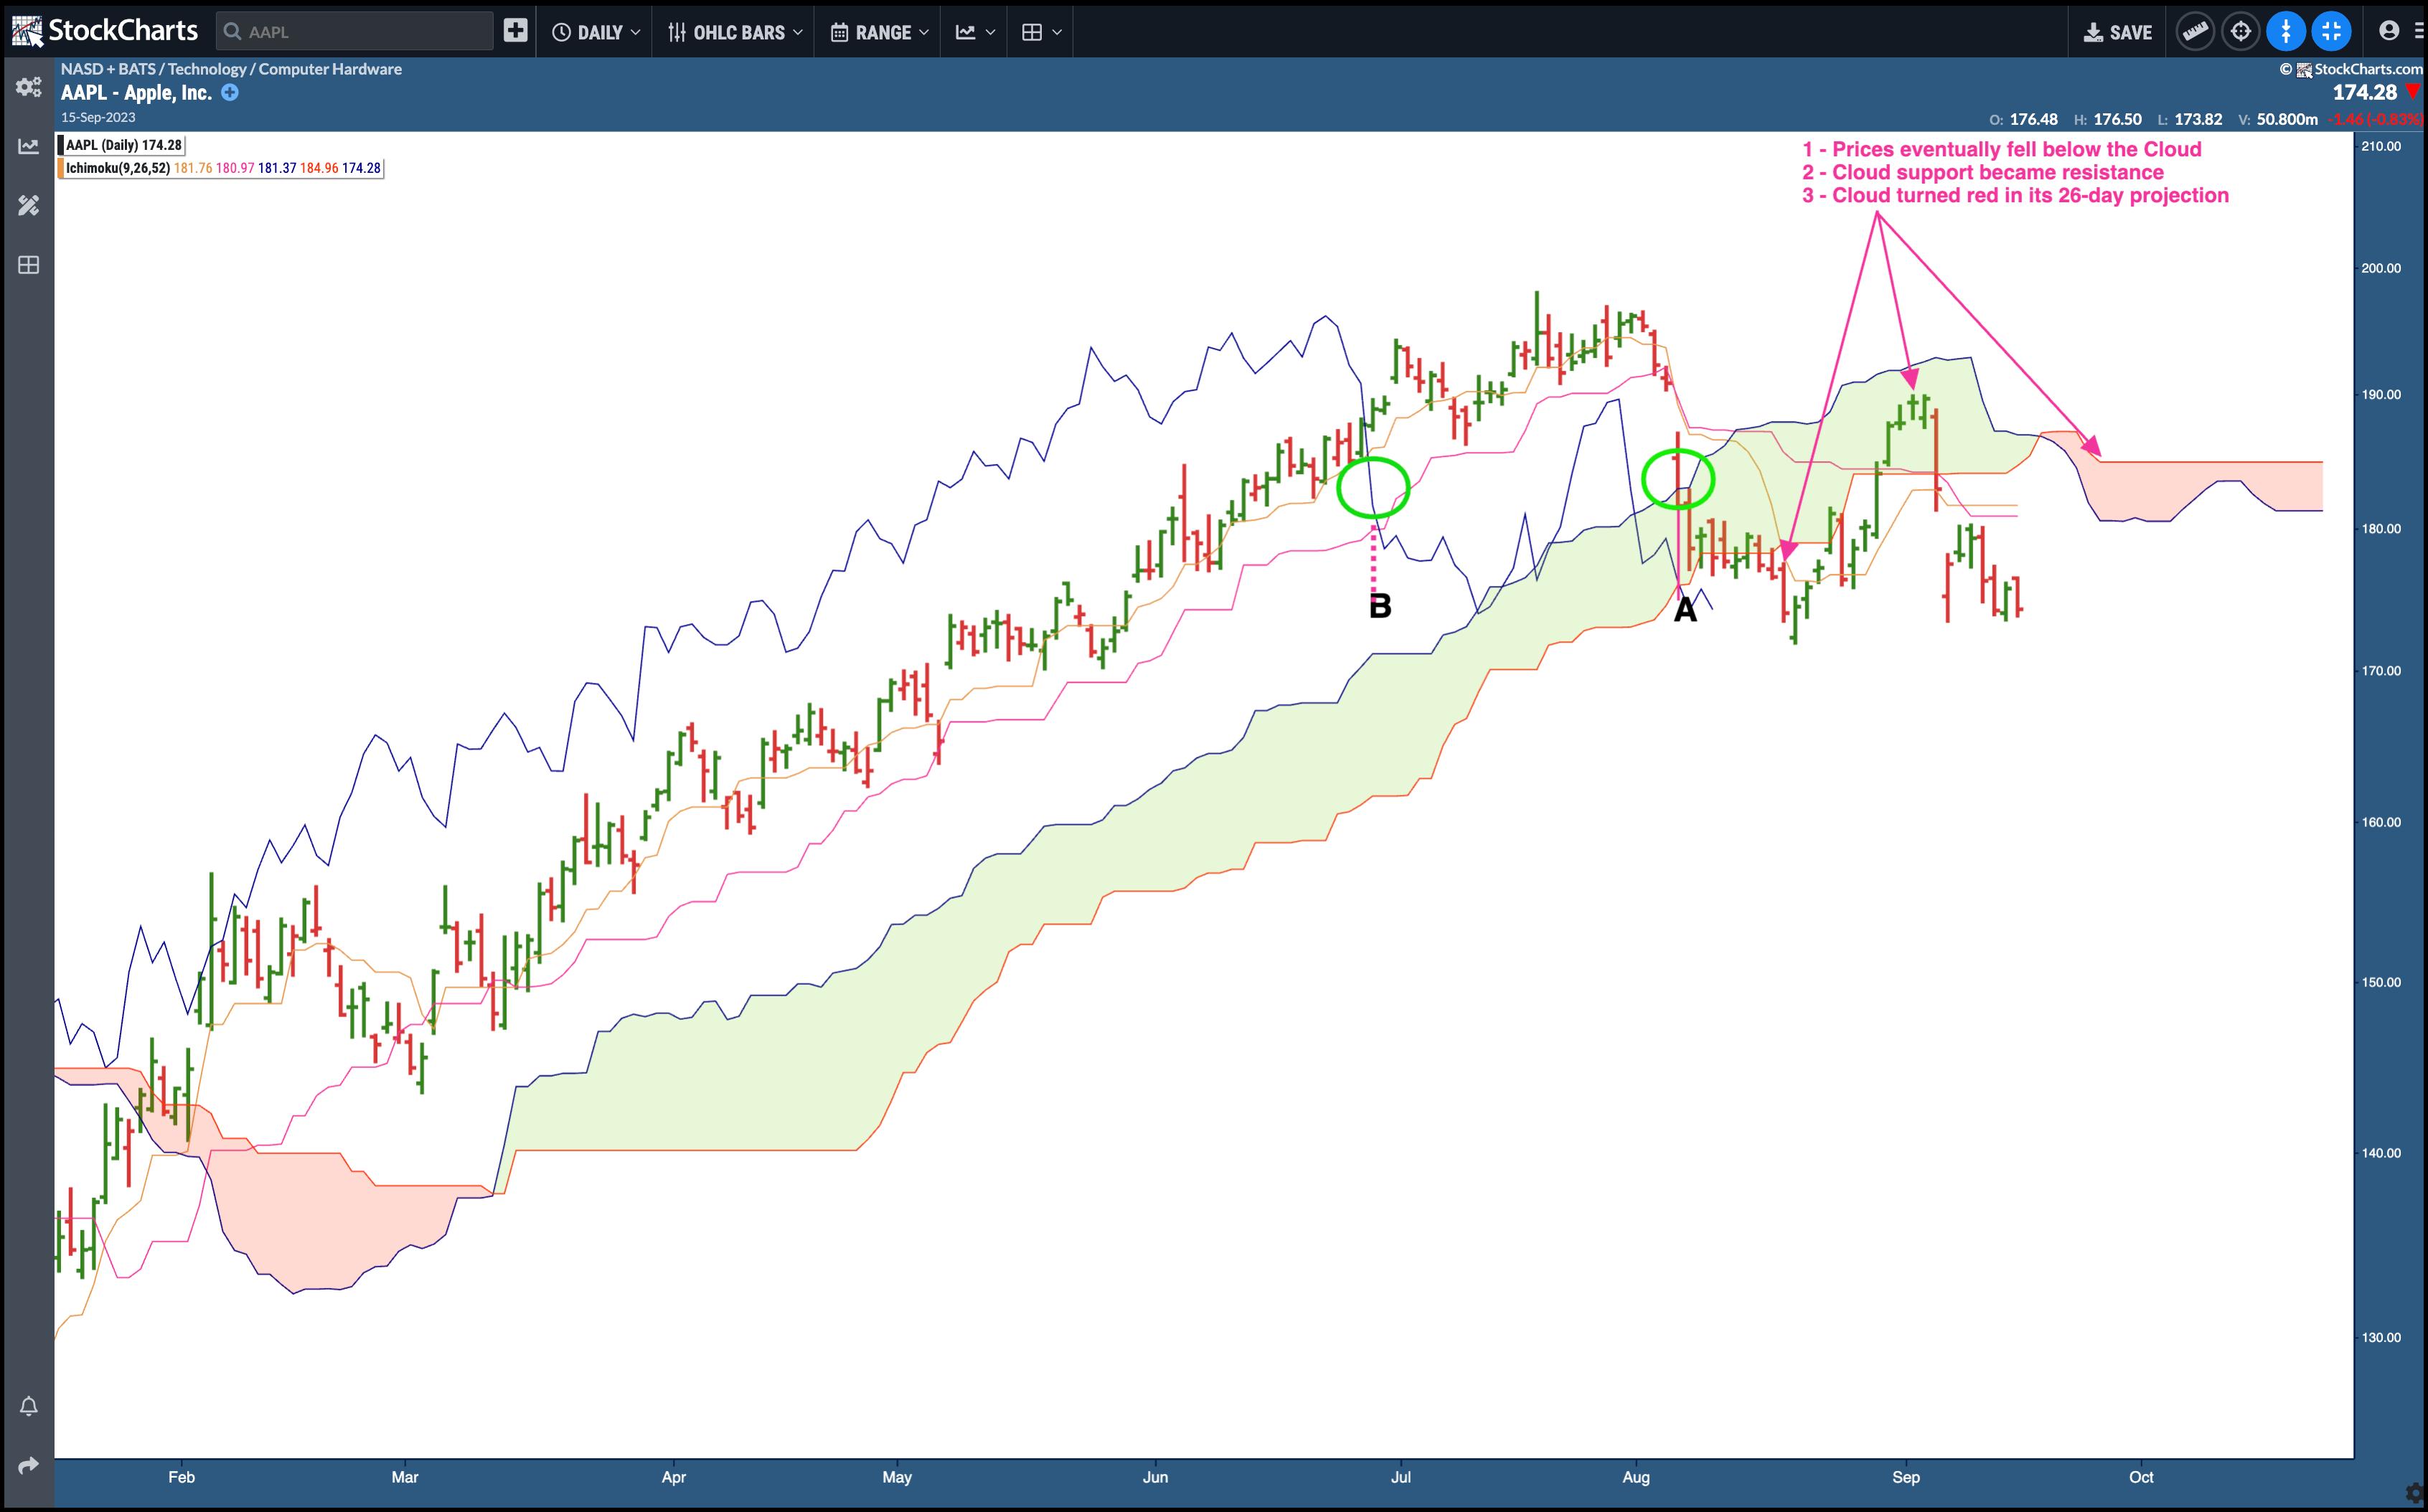
CHART 2. AAPL, CHIKOU SPAN, AND THE CLOUD (OR "KUMO"). The Chikou Span gave a bearish signal when it fell below past prices, but you have to look at other Ichimoku components to get a more accurate read on current and potential future price movements.Chart source: StockChartsACP. For educational purposes.
Note the two green circles labeled A and B. When price gapped lower at A, it coincided with the Chikou Span crossing below prices 26 days prior, as shown at B.
When the Chikou Span crossed below price and the Tenkan-sen (conversion line) and Kijun-sen (base line), it's considered a bearish indication. As you can see, prices continued to fall. However, price also falls into the Cloud (aka Kumo), generally viewed as potential support.
So there are two conflicting signals: a potential trend reversal signaled by the crossovers, but potentially bullish support in the cloud. Which one is it going to be, bullish or bearish? This is where the nuances set in, and it depends on the kind of trader you are and how you use the rest of the Ichimoku components.
- An aggressive trader might have used the negative Chikou Span crossovers as a signal to go short.
- A less aggressive trader would have waited for the Chikou Span to cross below the Cloud itself (which hasn't yet happened).
Note the outcome: Prices eventually fell through the cloud, but found support. However, upon re-entering the cloud, support became resistance, and the cloud eventually turned a bearish red. What happens next is anyone's guess. While the aggressive approach happened upon a good outcome, it wasn't the "safest" trade to take. So, it depends on your risk tolerance and approach to the markets.
So, what might have been a better trade based on a Chikou Span crossover? Let's go back to March 2023.
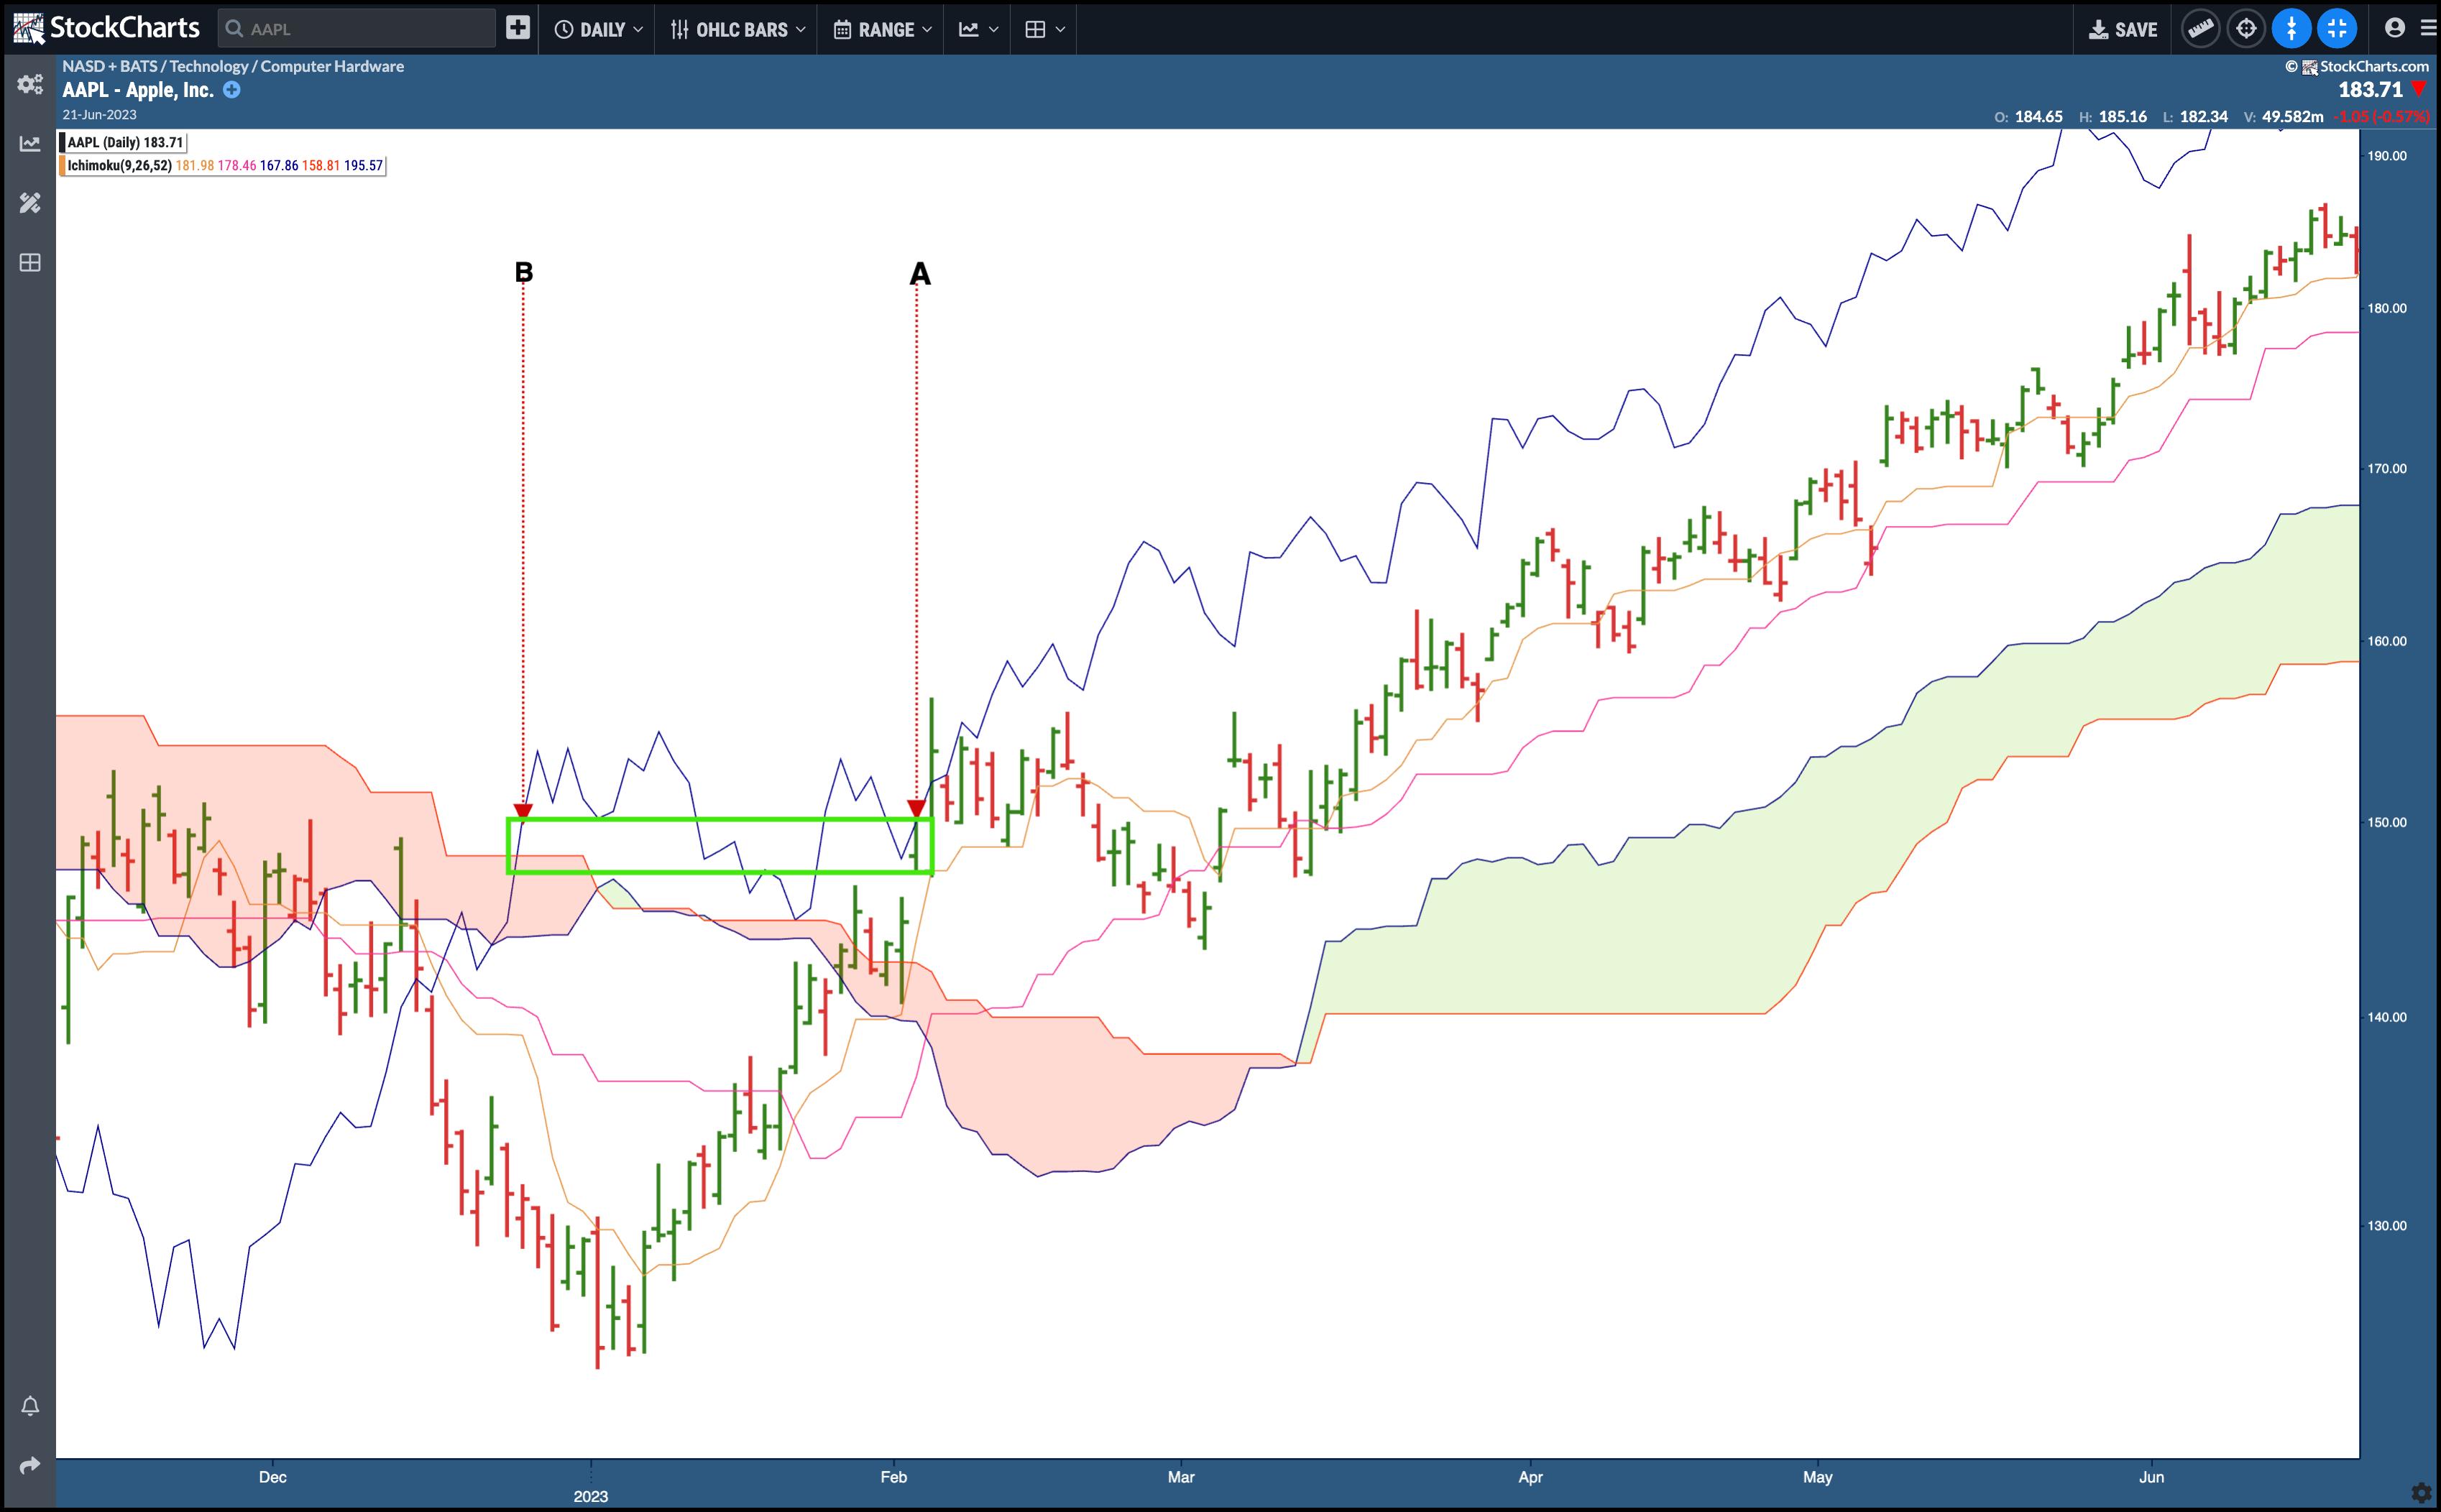
CHART 3. AAPL AND CHIKOU SPAN. The Chikou Span turned bullish before most other indicators did.Chart source: StockChartsACP. For educational purposes.
At the beginning of February 2023, the stock price (point A) was still recovering from an ugly combination of decline and consolidation. There were a few layers of resistance overhead, and there weren't many strong indications that prices were about to make a break for the upside, save for one bullish signal: the Chikou Span (point B) crossed above price, the conversion and base lines, and the cloud itself.
What followed was an uninterrupted seven-month uptrend, and the Chikou Span crossover was one of the earliest indications that prices were getting revved up to soar.
The Bottom Line
The Ichimoku Kinko Hyo can be an effective trading tool that offers a holistic market view through its five components. Among these, the Chikou Span's 26-day look-back feature is particularly unique, as it provides retroactive insights that can, ironically, be used to forecast future price action. While this "Lagging Span" operates with a 26-day delay, this doesn't diminish its anticipatory value. Instead, it underscores the importance of retrospective analysis, proving that sometimes a look back can offer the clearest view forward.