ChartWatchers June 25, 2021 at 07:17 PM
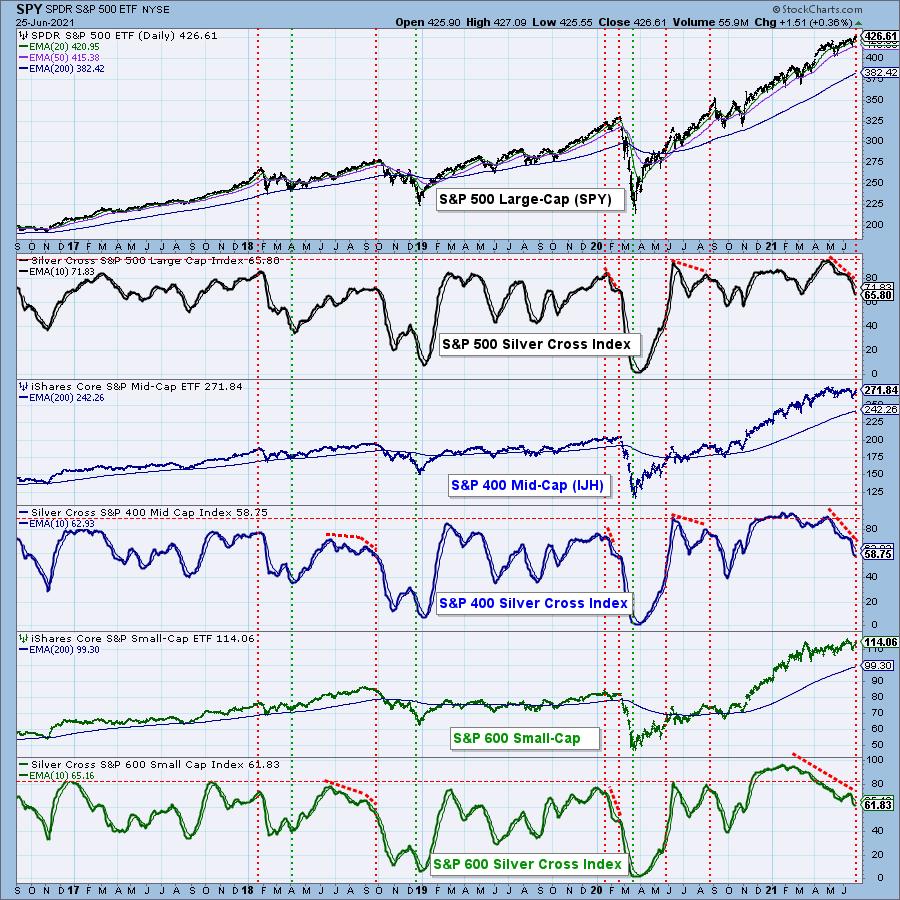
(This is an excerpt from today's DecisionPoint Weekly Wrap) When the 20-EMA crosses up through the 50-EMA, we consider that to be an intermediate-term BUY signal (a "silver cross") and track the percentage of stocks with BUY signals in a given market index with the Silver Cross I... Read More
ChartWatchers June 25, 2021 at 05:50 PM
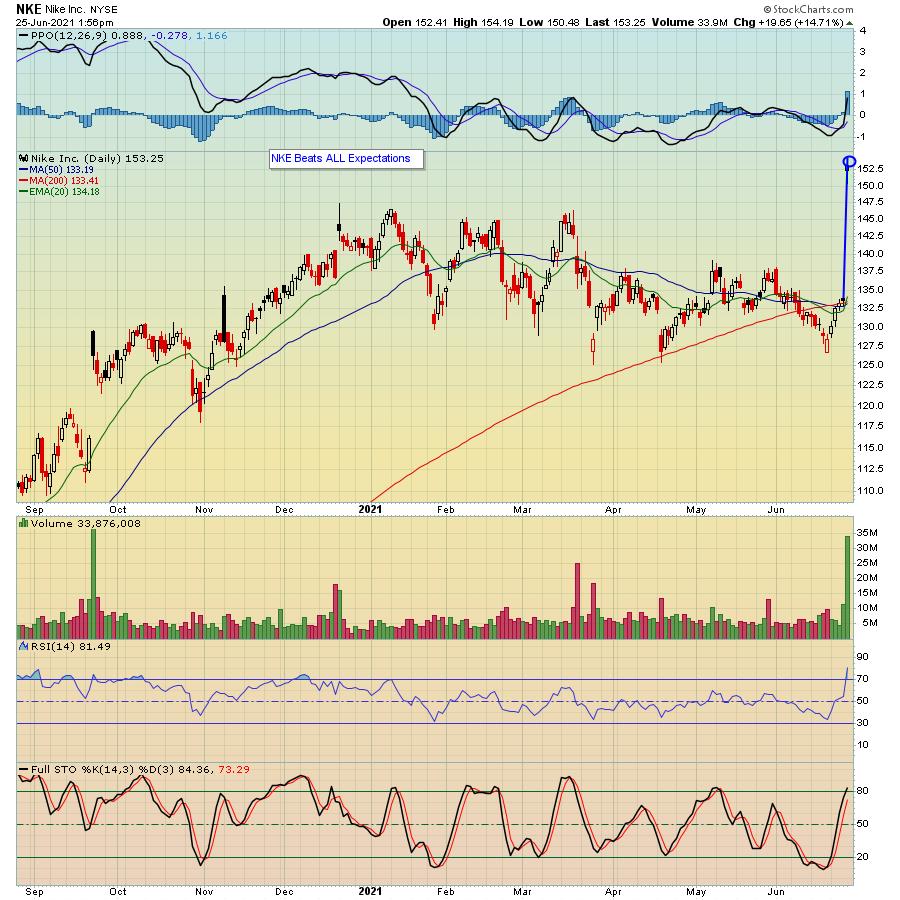
Nike (NKE) reported blowout earnings Thursday after the bell and the market liked what it heard and saw, with the stock rising by 15% when it opened for trading on Friday. The company smashed all expectations and even guided higher, a combo that launched it to an all-time high... Read More
ChartWatchers June 25, 2021 at 05:06 PM
Traders interested in Treasury bonds, Treasury bond ETFs and yields would be better off ignoring Fed-speak and focusing on the charts. The bond market leads the Fed, not the other way around. There is a battle raging for the heart and soul of the bond market... Read More
ChartWatchers June 25, 2021 at 11:58 AM
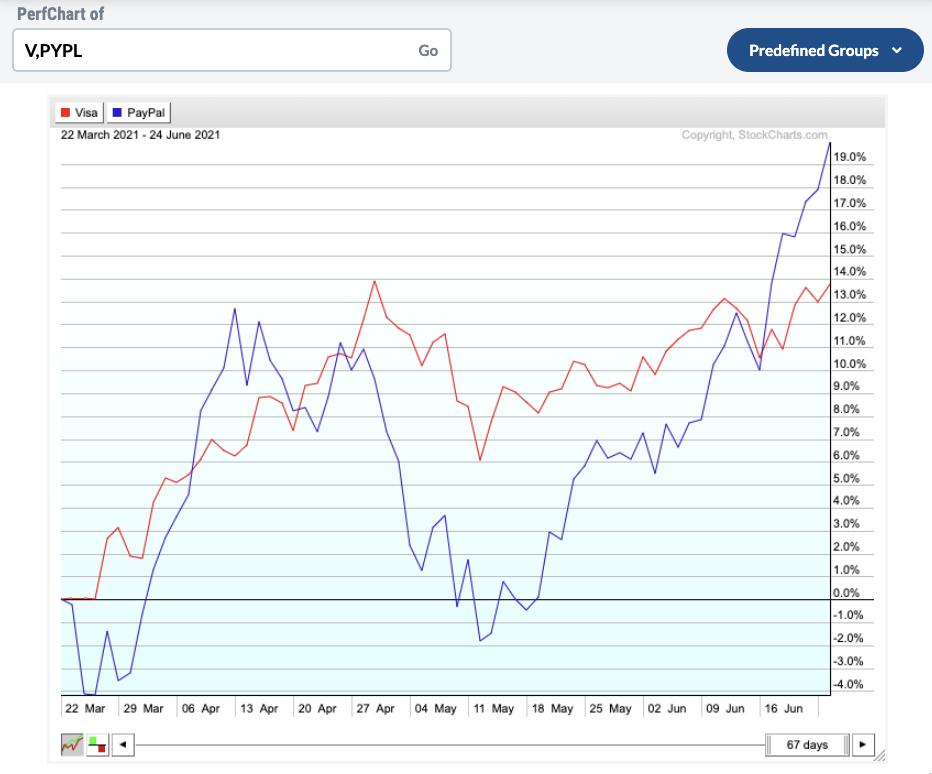
This past spring, Tom Bowley, Grayson Roze, David Keller and Greg Schnell got together for a stock selection process we called Chart Madness. This article is an update on the stocks from that event. Everything started 67 days ago on March 22. The first two were Visa vs. Paypal... Read More
ChartWatchers June 18, 2021 at 10:28 PM
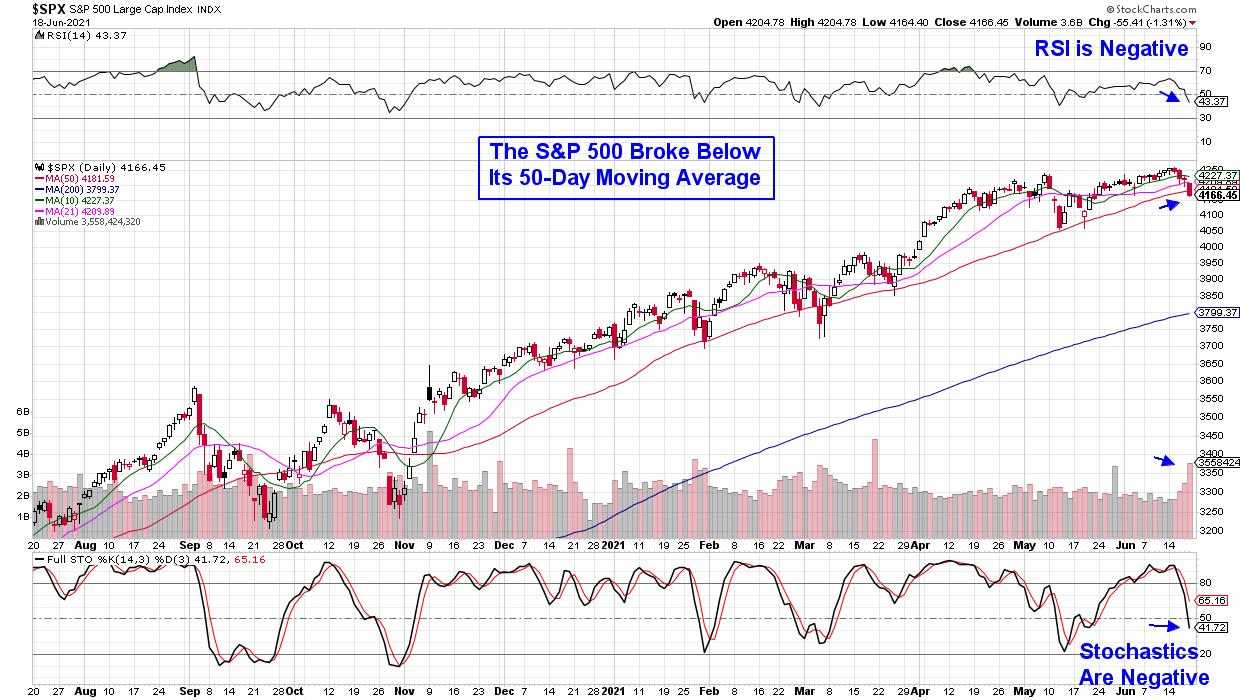
The U.S. markets ended the week in the red, with the S&P 500 breaking below its key area of support today on heavy volume... Read More
ChartWatchers June 18, 2021 at 07:03 PM
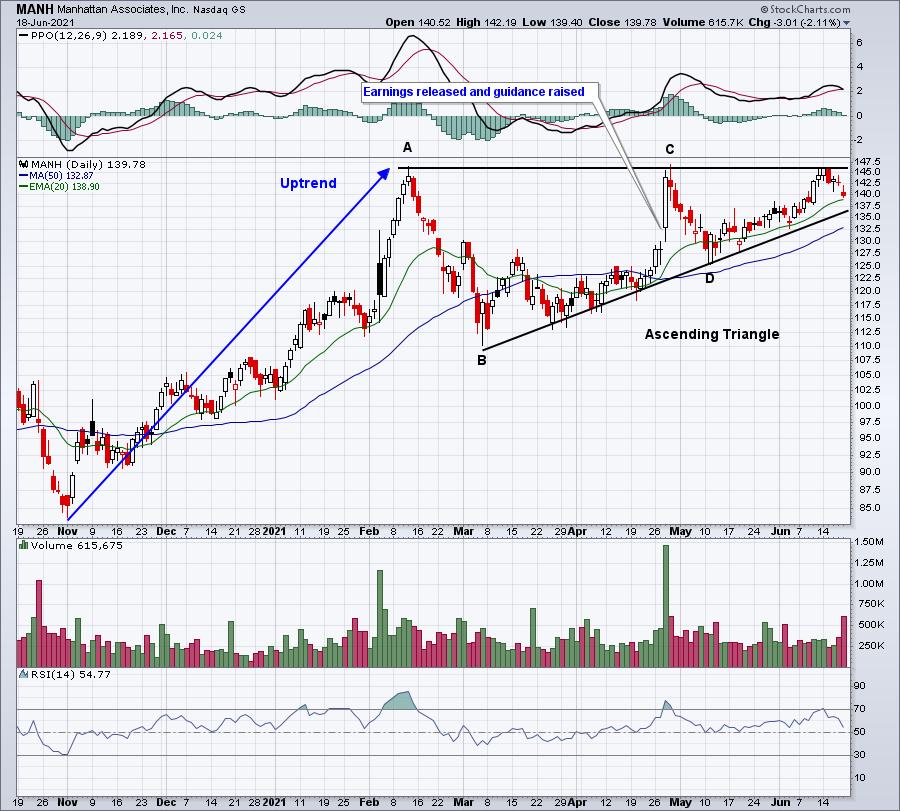
One of our key ChartLists at EarningsBeats.com is our Raised Guidance ChartList. As the name implies, it tracks companies that raised their revenue and/or EPS expectations at some point over the last 90 days... Read More
ChartWatchers June 18, 2021 at 06:58 PM
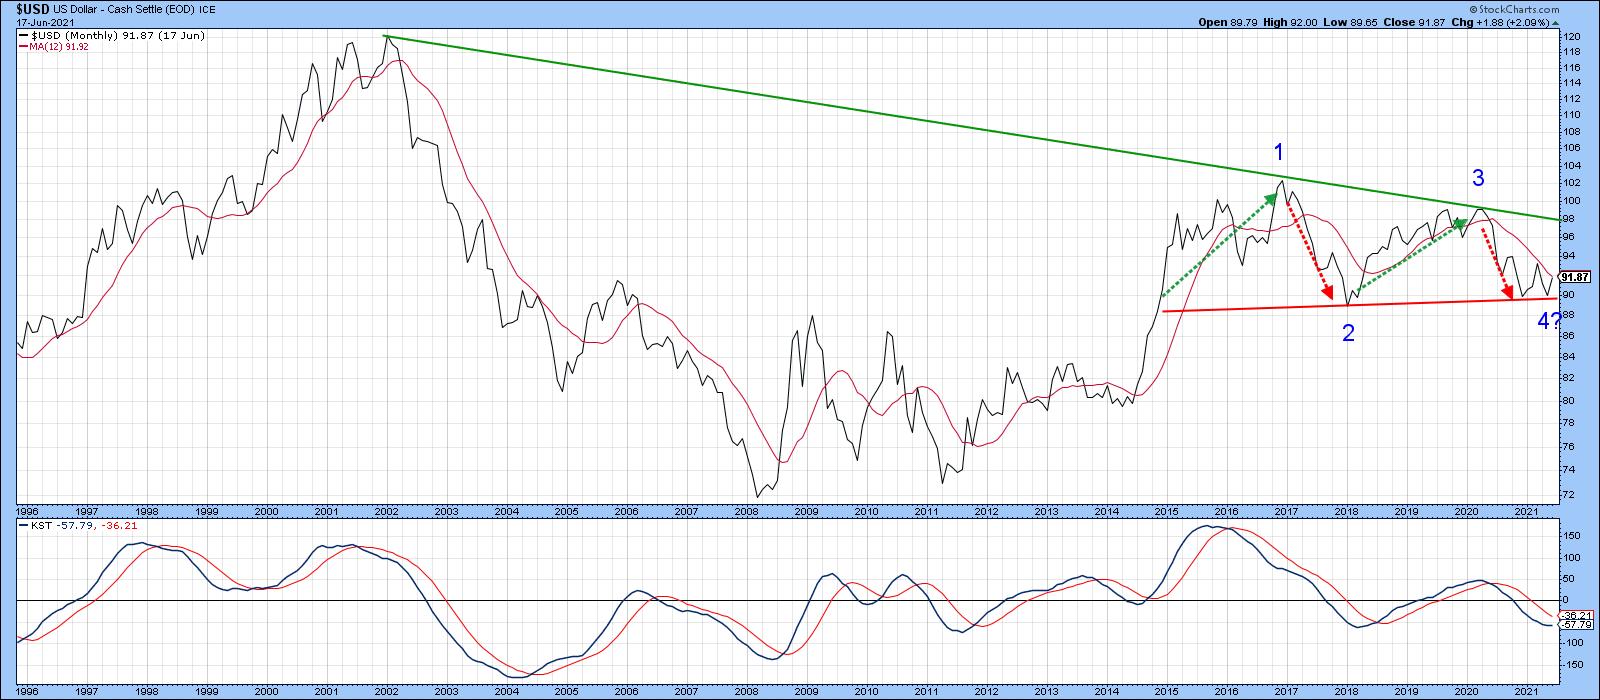
Chart 1 shows that, since 2015, the Dollar Index has been in a narrowing trading range bounded by two converging trendlines. That period has also embraced the end part of the 2011-2016 bull market, a mini-bear and bull market and the current bear... Read More
ChartWatchers June 18, 2021 at 02:24 PM
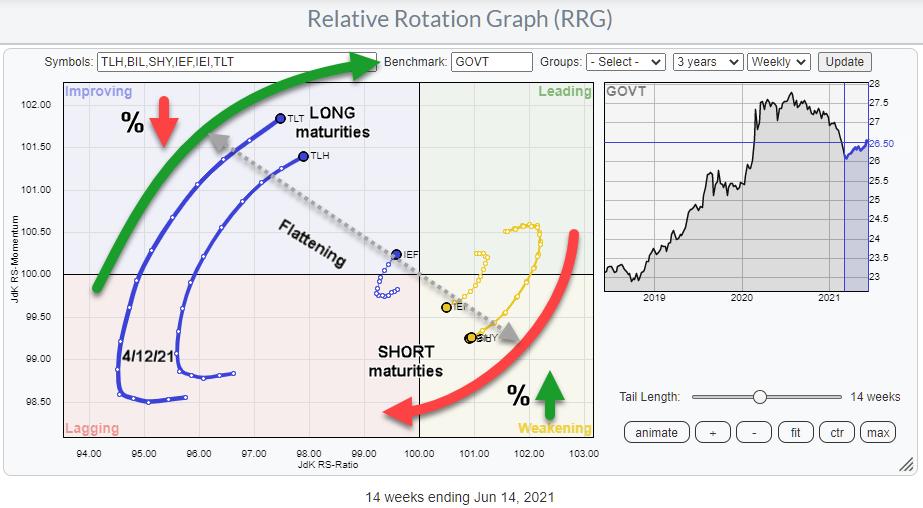
There's been a lot of talk and articles on rates, rising yields, and rate hikes lately. That seems like a good moment for a reminder of the fact that Relative Rotation Graphs can also be very well used to visualize the (relative) movement of yields for various maturities... Read More
ChartWatchers June 11, 2021 at 07:56 PM

Each week in my DecisionPoint Diamonds reports, I give readers 10+ stock picks to consider. This week, we had 11 picks... Read More
ChartWatchers June 11, 2021 at 06:45 PM
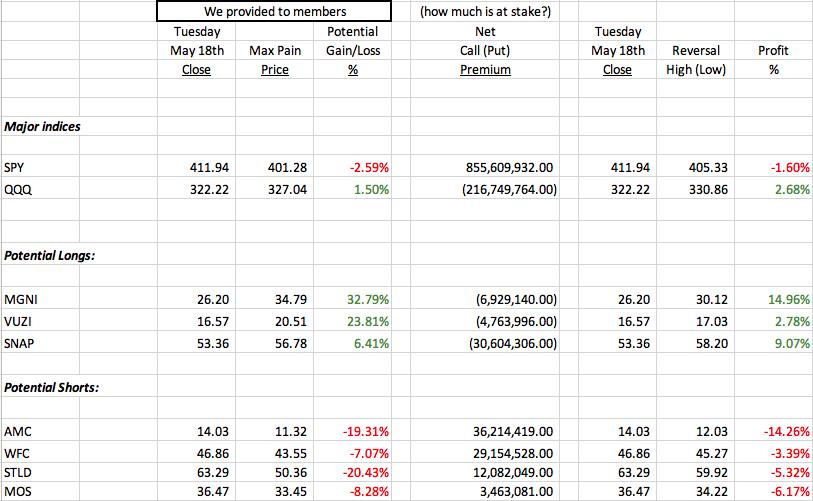
Friday, June 18th is the next monthly options expiration day and, if it's like recent option-expiration Fridays, then get ready for crazy reversals. To best illustrate how the madness around options expiration works, we'll review past results... Read More
ChartWatchers June 11, 2021 at 04:15 PM
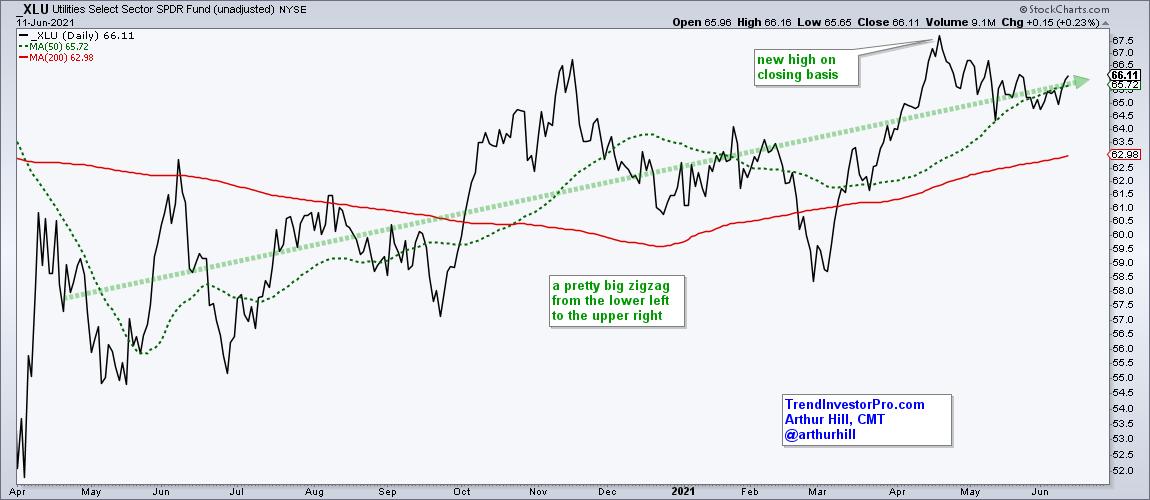
The Utilities SPDR is lagging the broader market over the last eight weeks, but a close look at price action reveals an uptrend, a bullish continuation pattern and an uptick in short-term momentum. Let's investigate... Read More
ChartWatchers June 11, 2021 at 11:15 AM
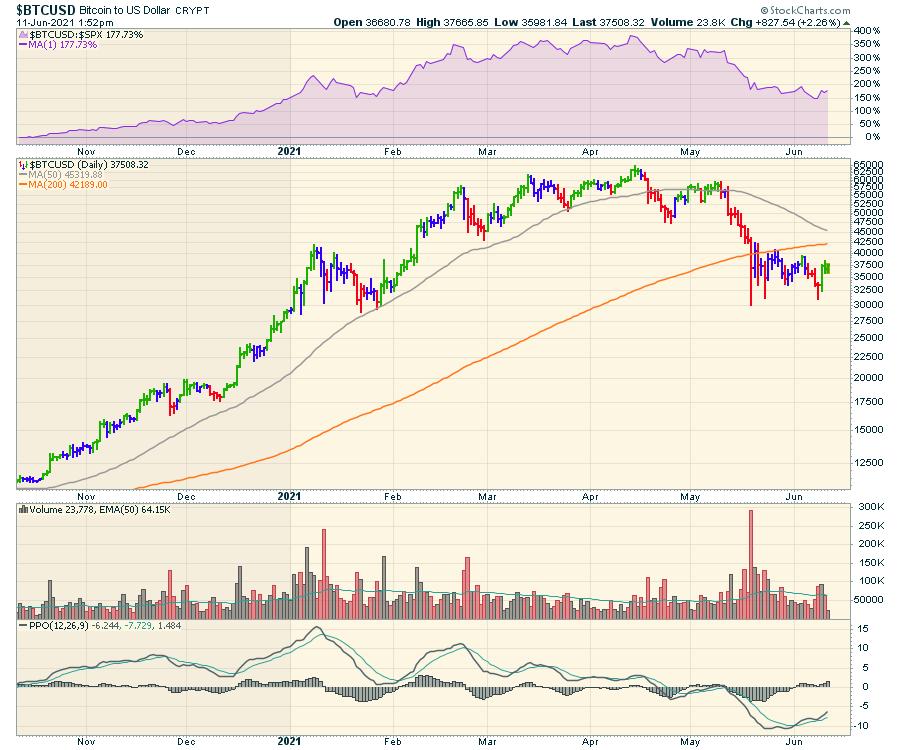
Bitcoin ($BTCUSD) is setting up some historical patterns, and it's worth watching to see how they play out. It's always easier when I don't have a crypto trade on. One of the patterns is the head-and-shoulders top... Read More
ChartWatchers June 05, 2021 at 12:51 AM
A number of winning stocks that performed well last year and into the first quarter of this year have seen dramatic drops in price... Read More
ChartWatchers June 05, 2021 at 12:35 AM
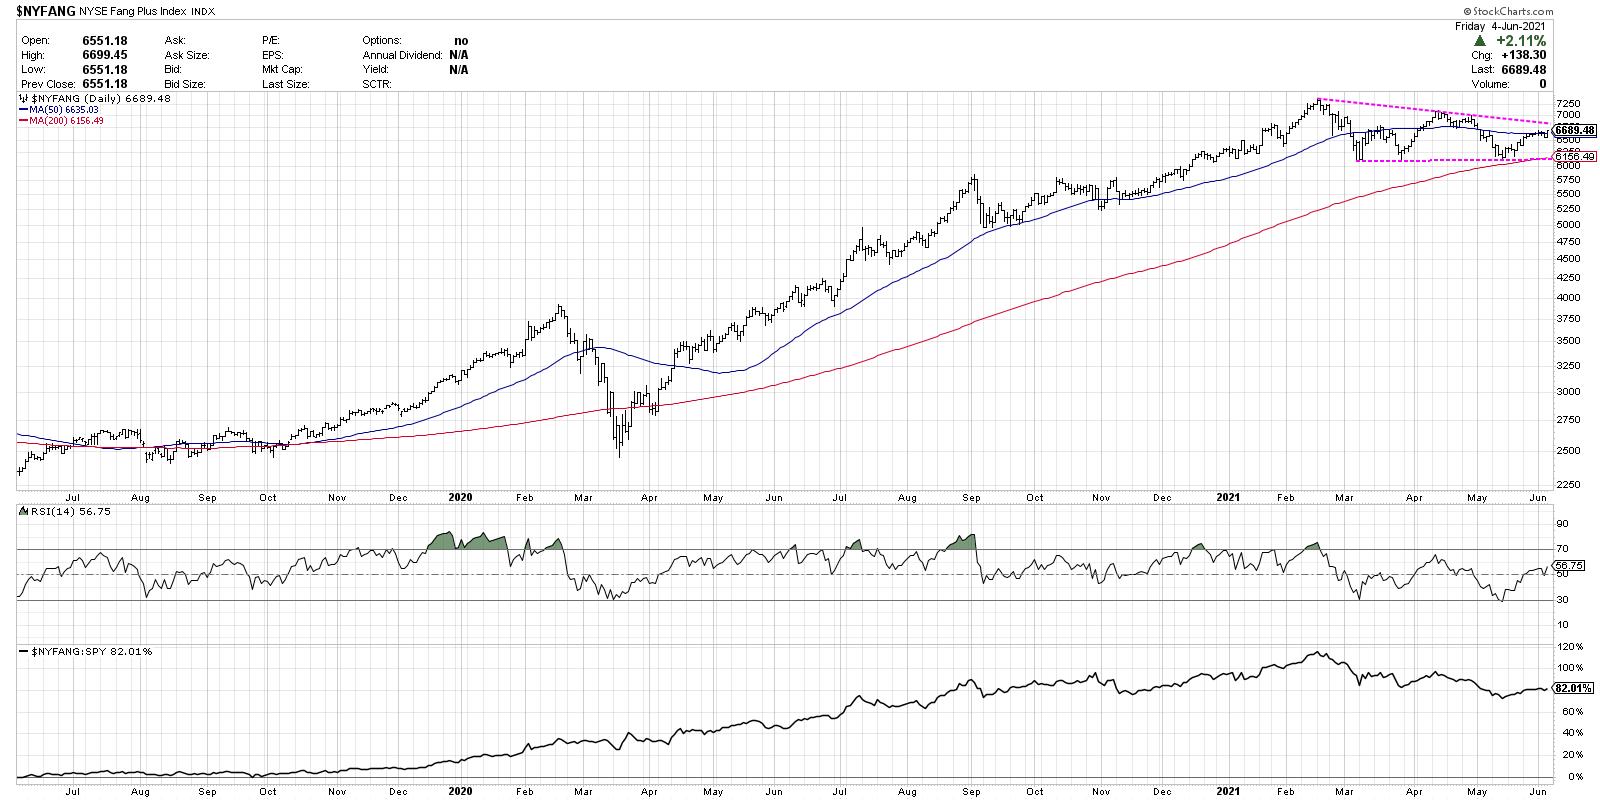
In John Murphy's classic text Technical Analysis of the Financial Markets, he explains that one of the three basic assumptions of technical analysis is that prices move in trends. For anyone that has looked at charts for any amount of time, this seems like an obvious truism... Read More
ChartWatchers June 04, 2021 at 06:55 PM
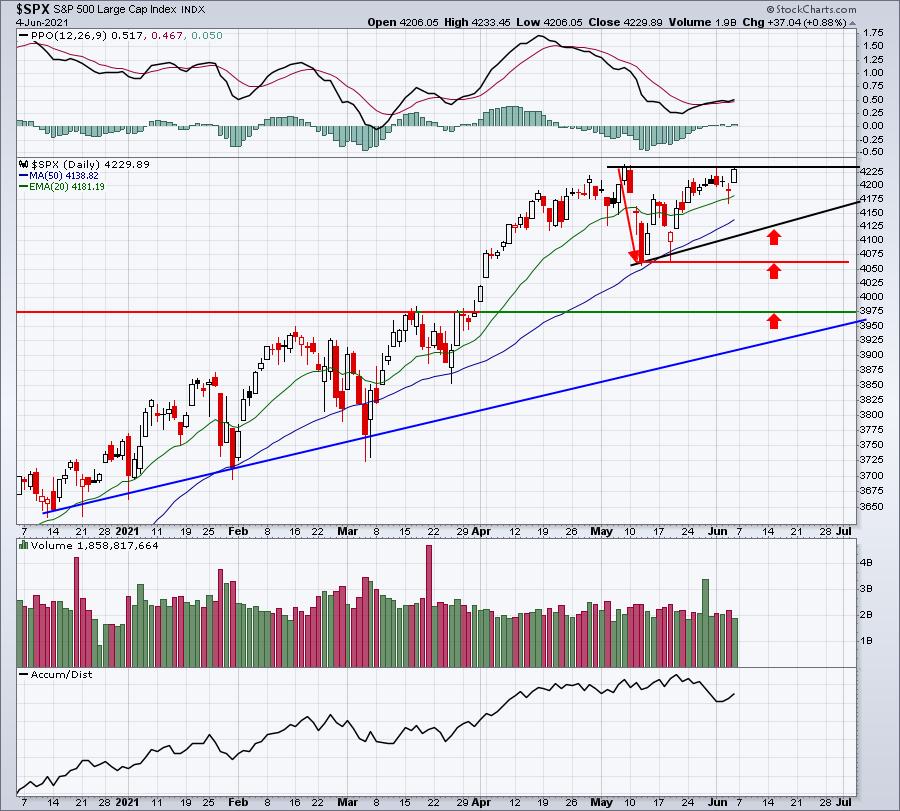
The S&P 500 reached a high on Friday of 4233.45, narrowly eclipsing the all-time high close of 4232.60 from May 7th. Unfortunately for the bulls, selling in the final few minutes ruined the breakout attempt... Read More
ChartWatchers June 04, 2021 at 02:07 PM

The improvement of commodities started already back in early 2020. Looking at long-term (monthly) charts, that rally seems like one straight move higher. This chart shows $GNX and GSG stacked on top of each other... Read More