ChartWatchers July 30, 2021 at 10:33 PM
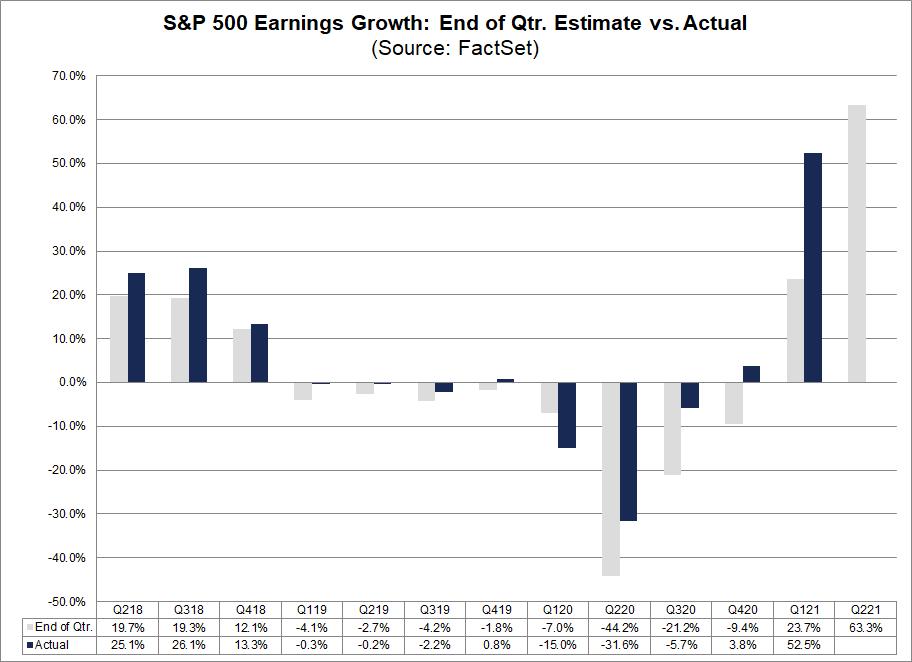
Over the past couple of weeks, over 50% of the companies in the S&P 500 have reported results for Q2 2021. Of those, 88% have reported EPS results above estimates. This is well above the average over the past five years... Read More
ChartWatchers July 30, 2021 at 09:35 PM
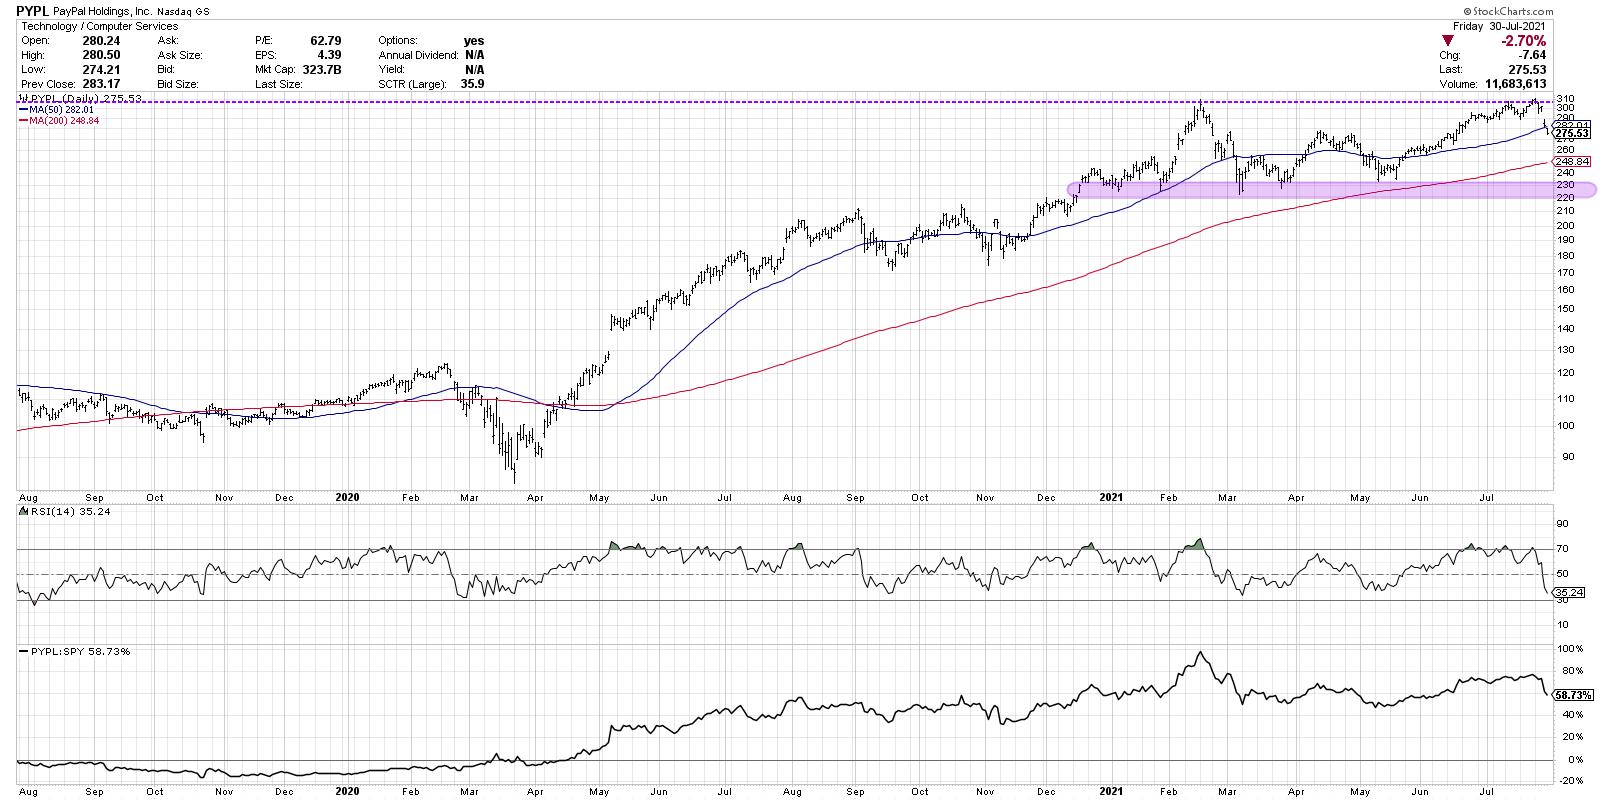
Markets in healthy uptrends, with improving bullish characteristics, see price breakouts follow through to further upside. Stocks like AAPL and AMZN and PYPL and others break above previous resistance levels and continue to push onward and ever upward... Read More
ChartWatchers July 30, 2021 at 06:53 PM
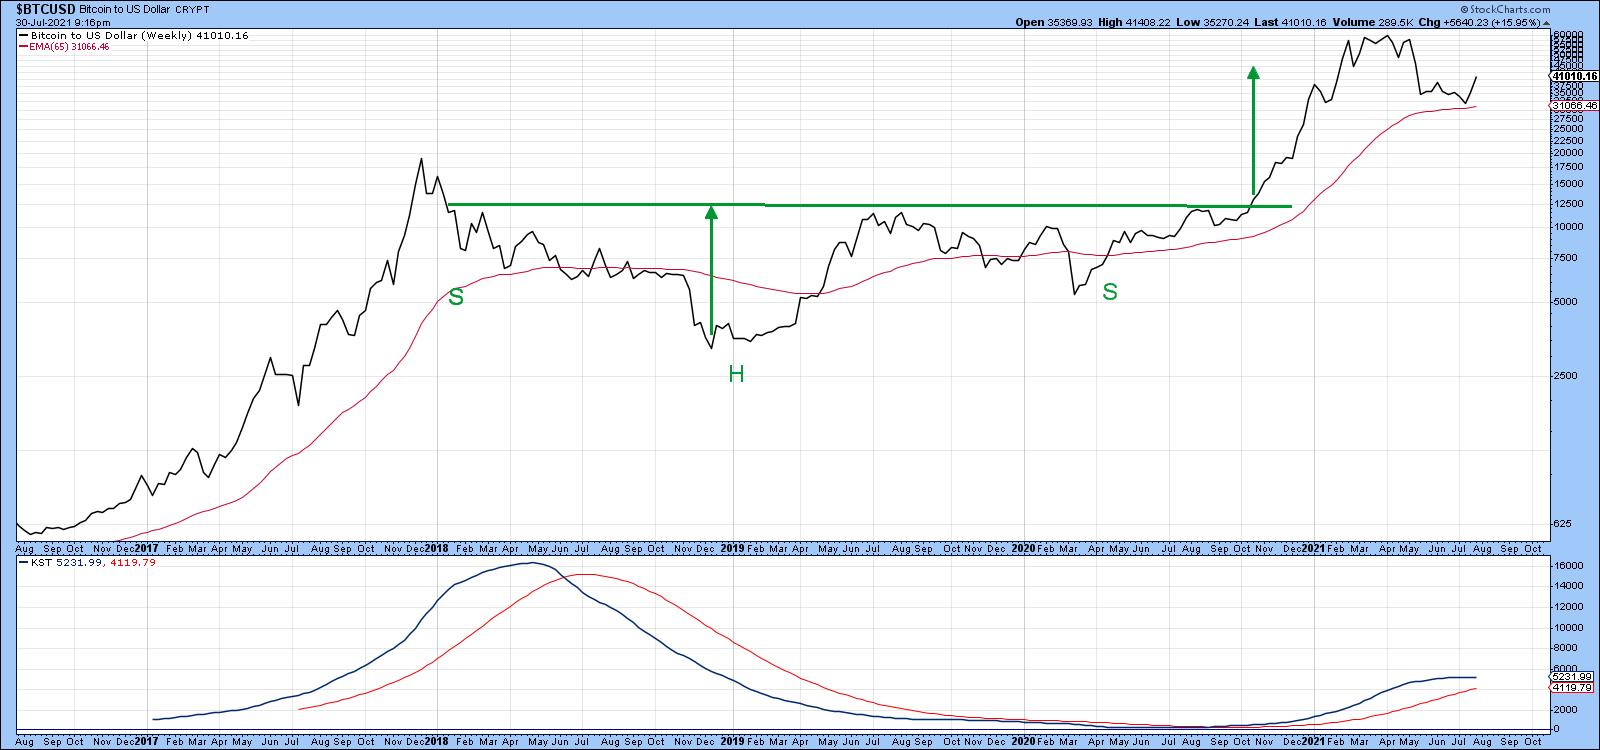
After months of quiet frustrating trading, Bitcoin finally broke out to the upside this week... Read More
ChartWatchers July 30, 2021 at 03:53 PM
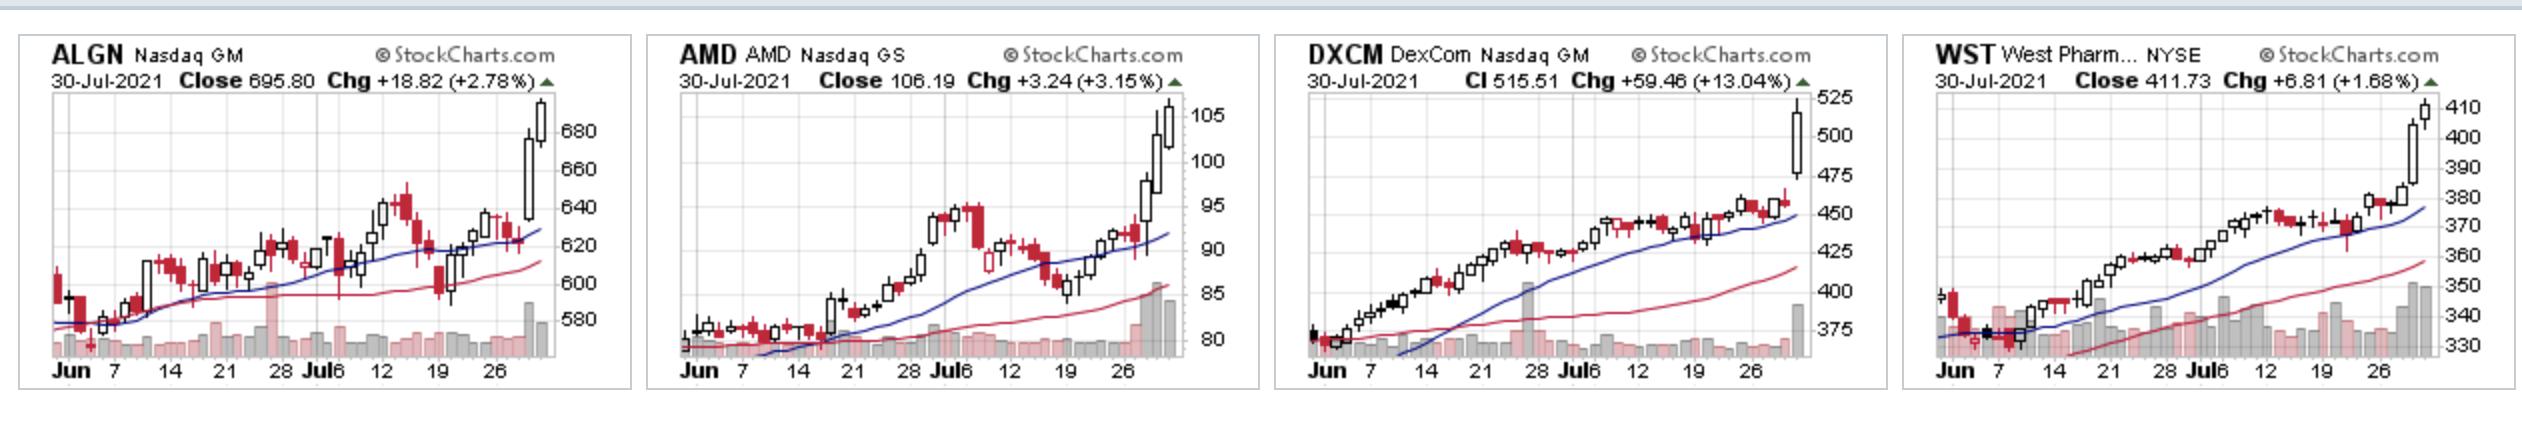
It's no secret that I'm a fan of leading stocks in leading industries. So, as we move through yet another earnings season -- and there's still plenty left in it -- I thought I'd review what I consider to be the best stocks in the best industries... Read More
ChartWatchers July 30, 2021 at 03:39 PM
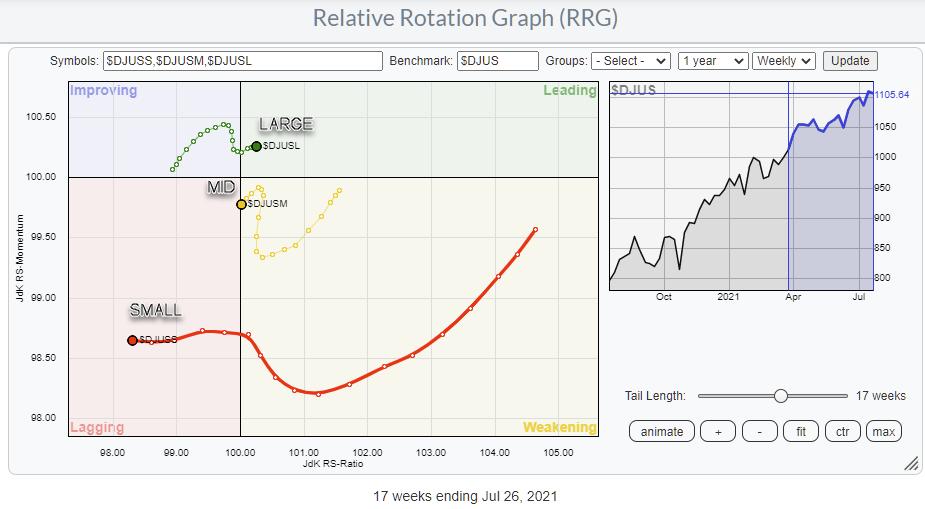
The Relative Rotation Graph showing the rotations for Large-, Mid- and Small-Cap indexes is sending a very clear message: Avoid Small-Caps. (And also Mid-Caps... Read More
ChartWatchers July 23, 2021 at 07:32 PM
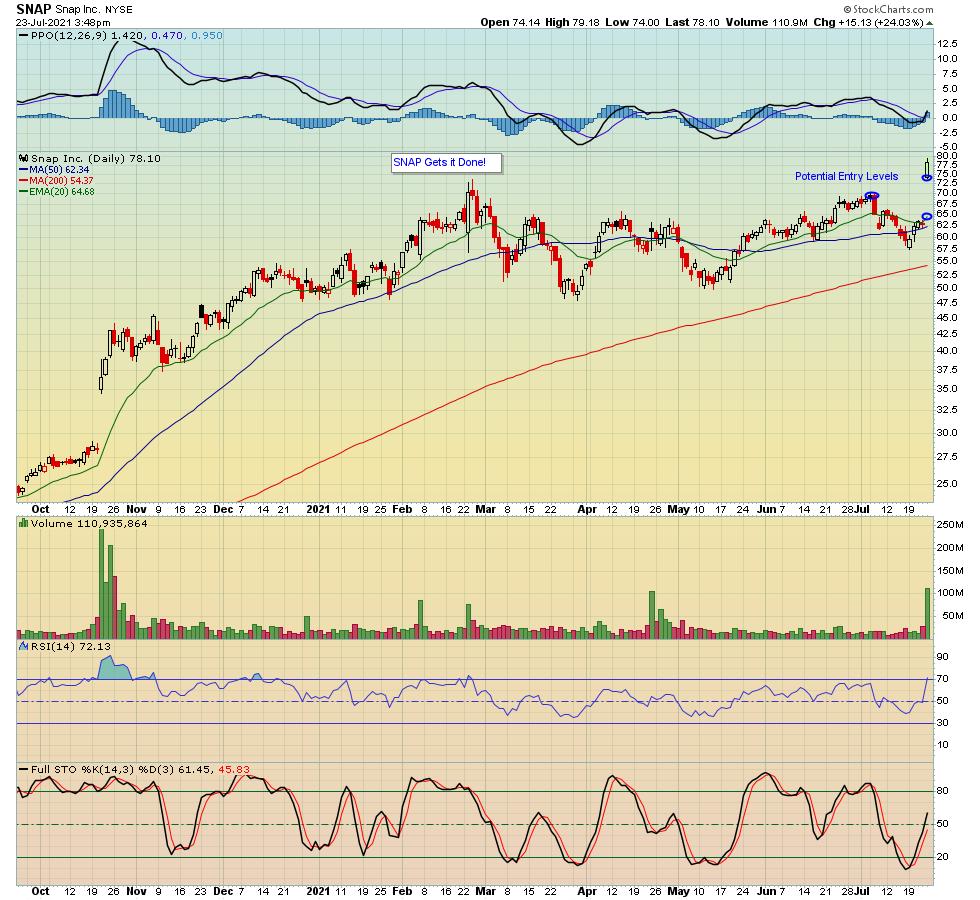
If you have been paying attention to earnings, you would have seen that SNAP reported their numbers on Thursday and crushed all expectations. As a result, the stock was higher by over 25% at its peak the day after the numbers were released... Read More
ChartWatchers July 23, 2021 at 07:23 PM
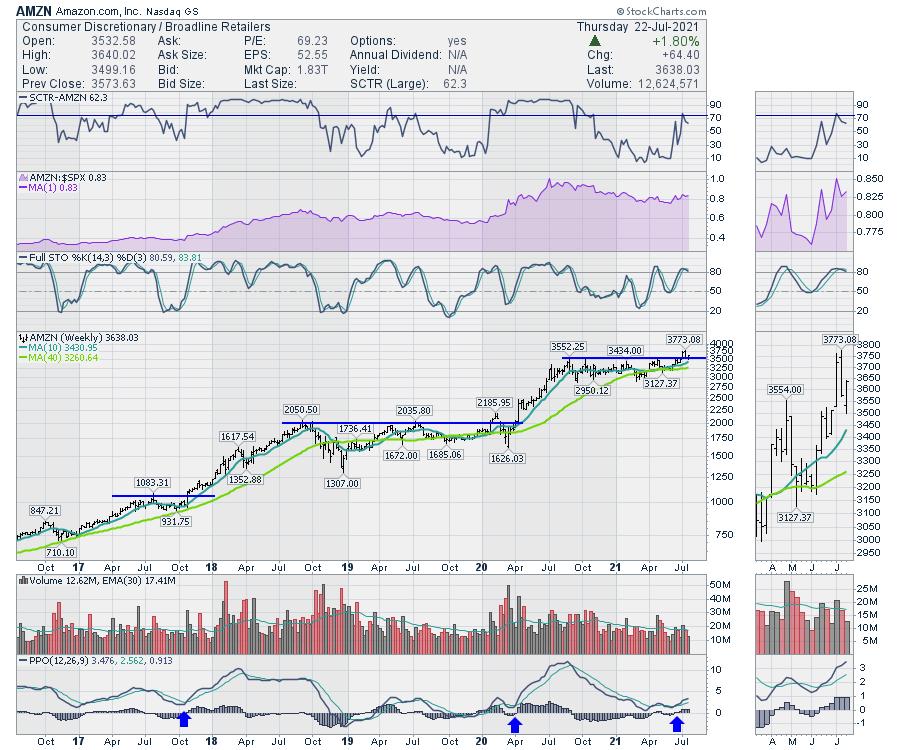
One of the interesting phenomena about investing is how stocks run up, consolidate for a period of time, then mark their next leg of the journey as they break out above the consolidation... Read More
ChartWatchers July 23, 2021 at 06:42 PM

On Fridays, as part of my subscriber-only DecisionPoint Diamonds Report, I give readers insight on how the Sectors did for the week, what our Sector Scoreboard and daily RRG look like and, most importantly, what sector and industry group to watch going into next week... Read More
ChartWatchers July 23, 2021 at 03:02 PM
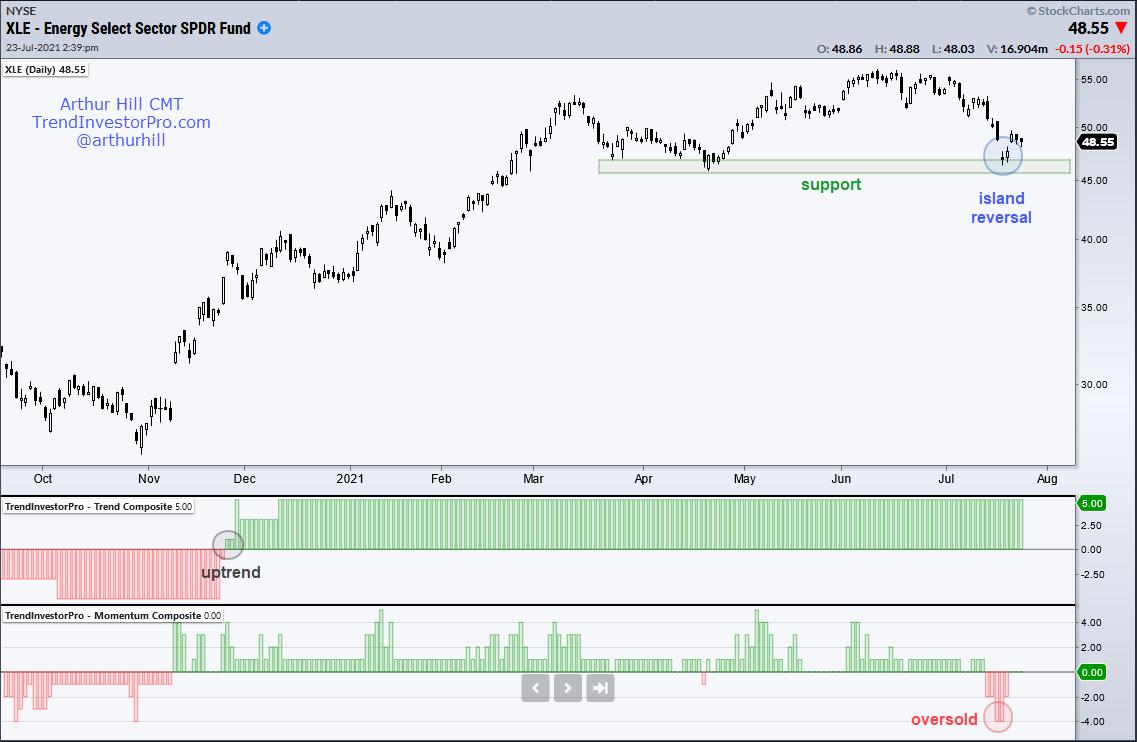
The Energy SPDR (XLE) is setting up to end its correction and resume its bigger uptrend. First and foremost, the long-term trend is up because the Trend Composite signaled an uptrend (gray circle) in late November when the majority of indicators turned bullish... Read More
ChartWatchers July 16, 2021 at 10:40 PM
If you want to uncover the next big winning stock, now is the ideal time to be screening the markets. Why? Because proven studies have shown that the #1 driver of a stock that goes on to far outpace the markets is big, accelerating earning-per-share (EPS) growth... Read More
ChartWatchers July 16, 2021 at 10:00 PM
As the S&P 500 and Nasdaq 100 indexes have pounded away at new all-time highs basically every month in 2021, investors are left to wonder when a correction may actually be coming... Read More
ChartWatchers July 16, 2021 at 07:15 PM
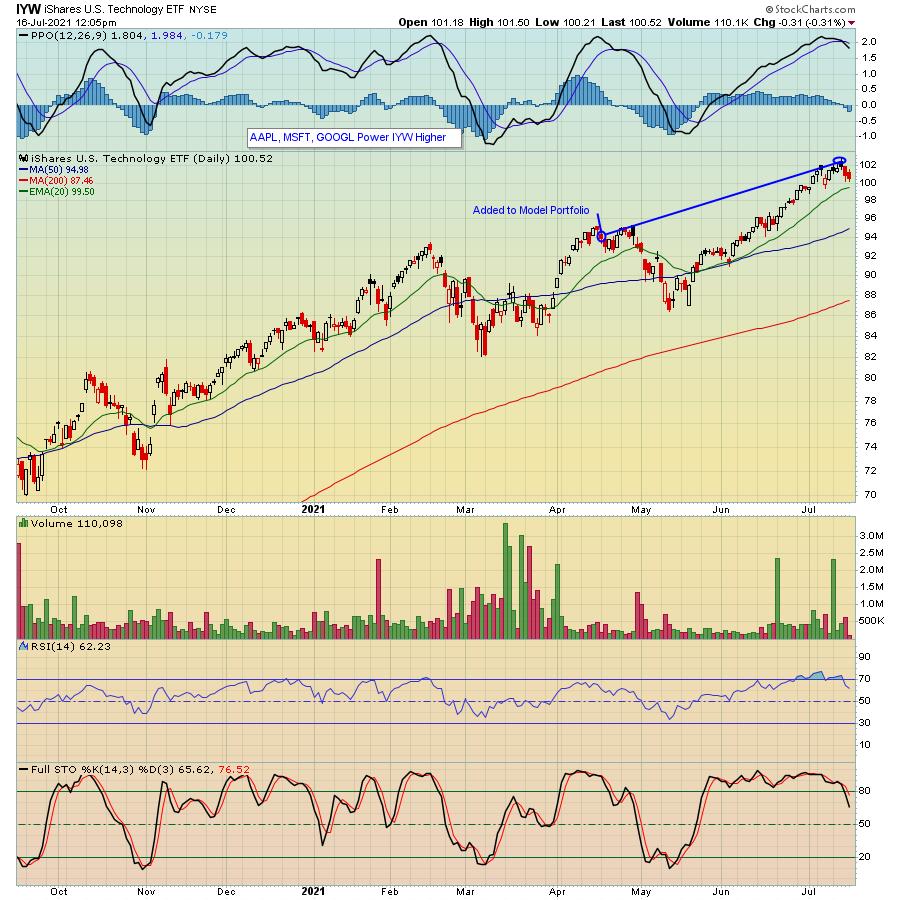
The IYW is a US Technology ETF. Its three largest holdings are AAPL, MSFT and GOOGL. At its peak this past Wednesday, it was higher by 9.4% from the date it was added to our ETF Model portfolio on April 19, compared to the S&P of 5.5% during the same period of time... Read More
ChartWatchers July 16, 2021 at 06:43 PM
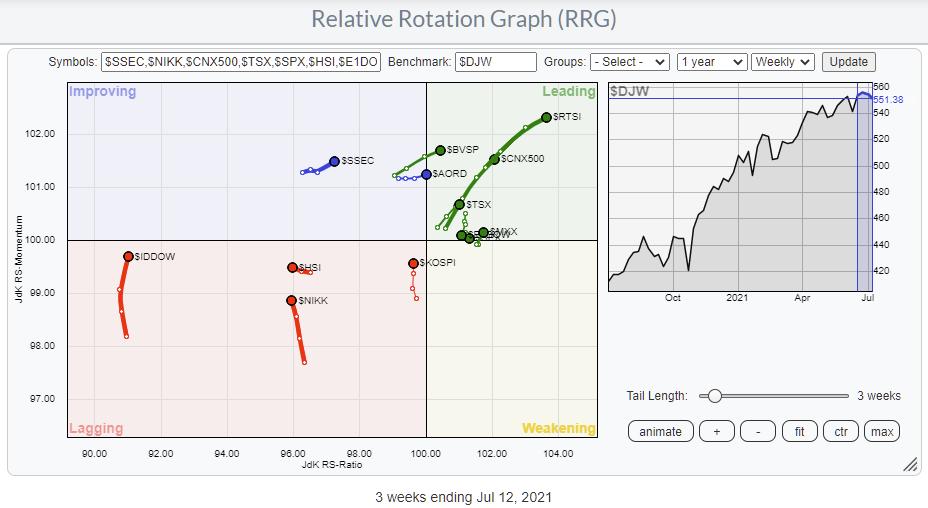
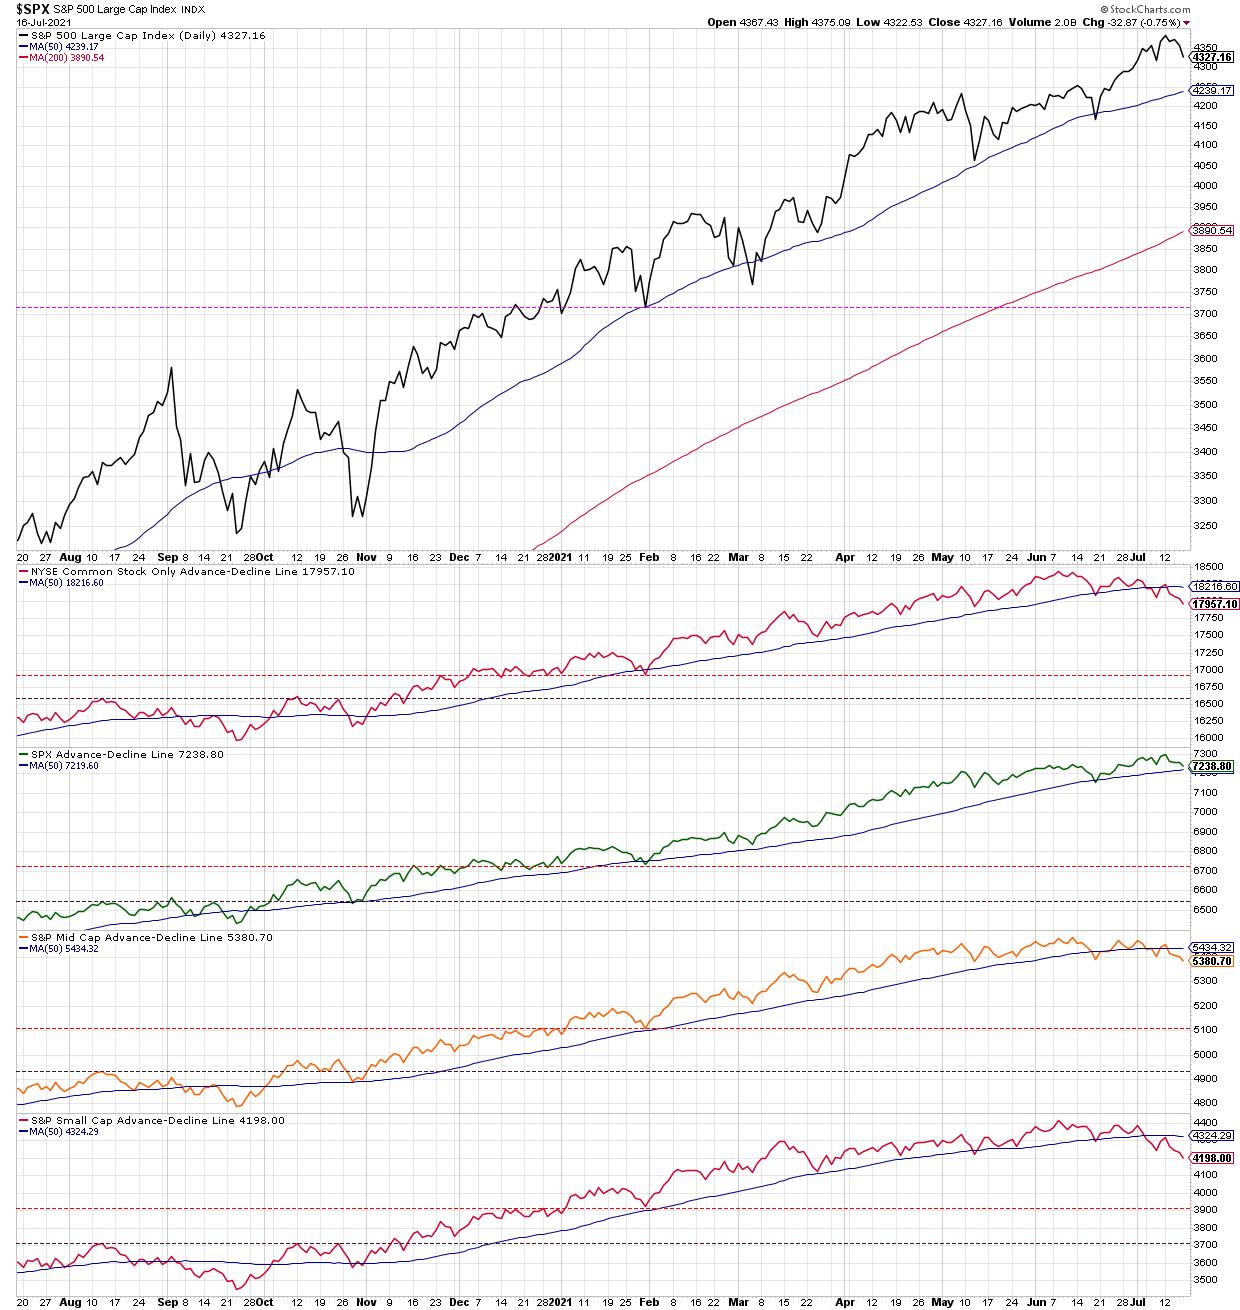
The Relative Rotation Graph above shows the rotation for major stock market indexes against the Dow Jones Global Index. First of all, this is a so-called "open universe" which means that not all constituents of the benchmark are plotted on the graph... Read More
ChartWatchers July 09, 2021 at 07:53 PM
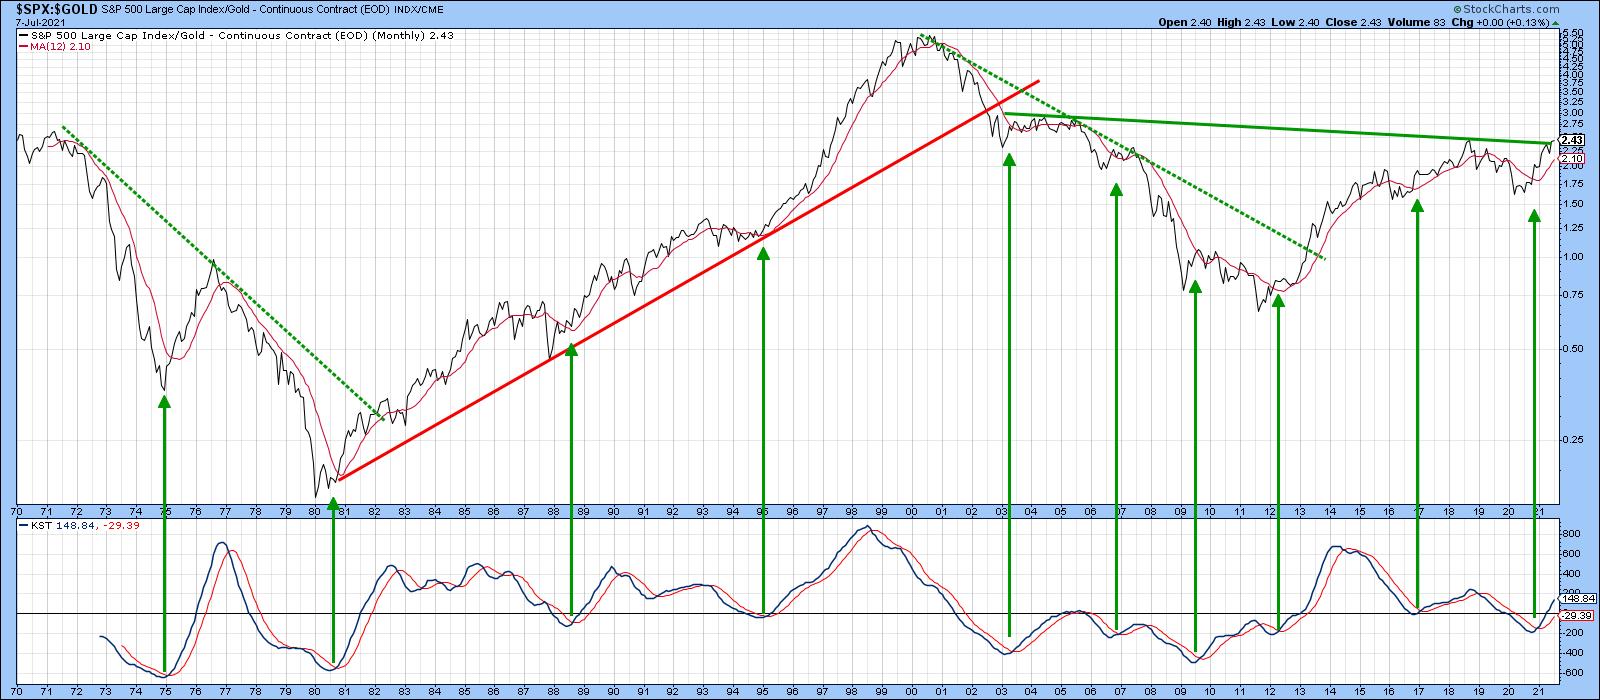
When reviewing my charts last weekend, several jumped out as being at a pretty critical juncture, and therefore worthy of monitoring going forward. A couple of them involved the stock market, so I'll start there... Read More
ChartWatchers July 09, 2021 at 07:33 PM
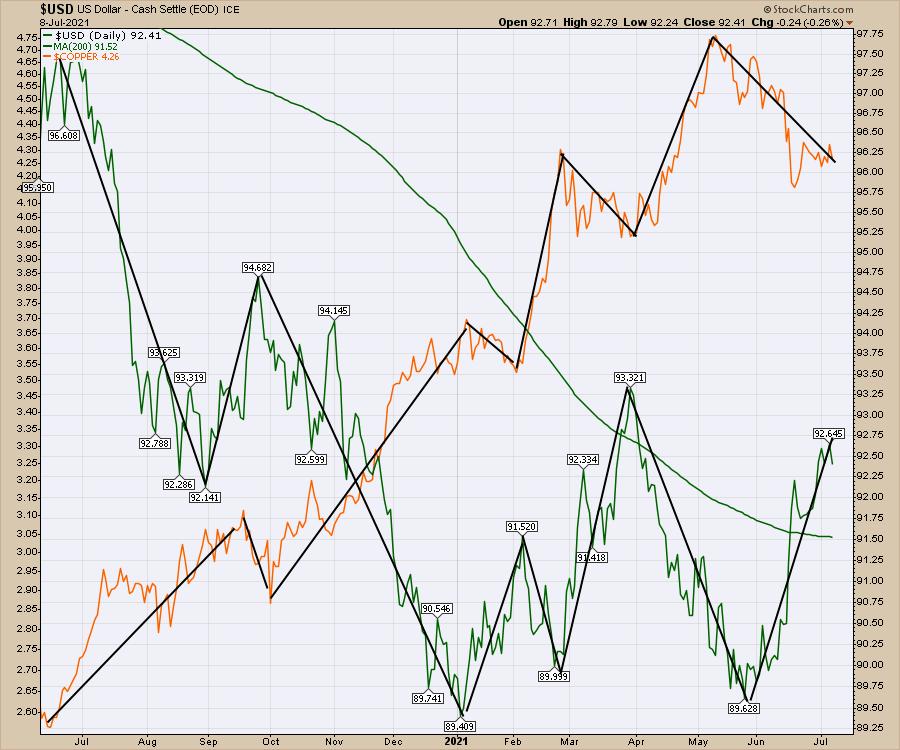
This is a pivotal point for the US Dollar. The US Dollar can have meaningful changes on commodities, bond flows and foreign investment, to name a few... Read More
ChartWatchers July 09, 2021 at 07:00 PM
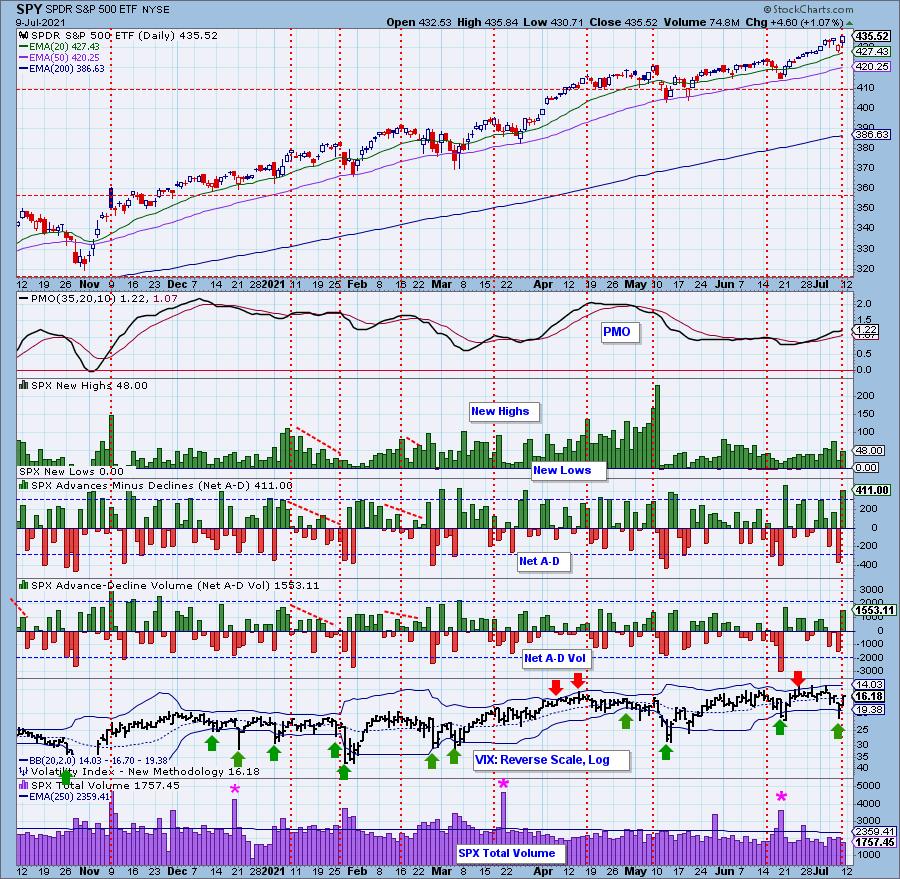
DecisionPoint employs "Climax Analysis" -- and only DecisionPoint.com has it. Determination of "climax days" is invaluable for the short-term trader... Read More
ChartWatchers July 09, 2021 at 06:07 PM

The Steel ETF (SLX) led the market from late October to early May by more than doubling in price. The ETF then fell back with a break of the 50-day SMA in June, but this decline is viewed as a correction within a bigger uptrend... Read More
ChartWatchers July 09, 2021 at 02:37 PM
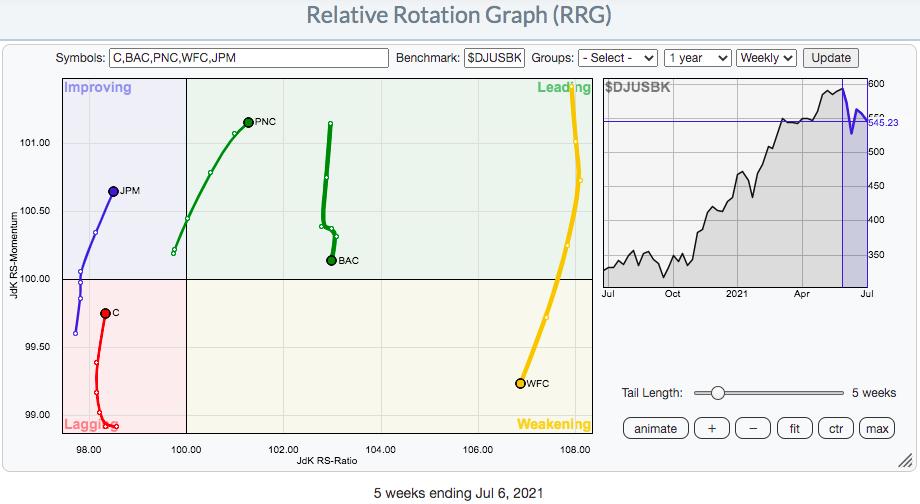
Earnings season kicks off next week, with the big banks getting things started. After a rough stretch with falling treasury yields, the banks index ($DJUSBK) rallied on Friday as yields rebounded. Recently, I provided a relative strength look at key banks reporting next week... Read More
ChartWatchers July 02, 2021 at 11:29 PM
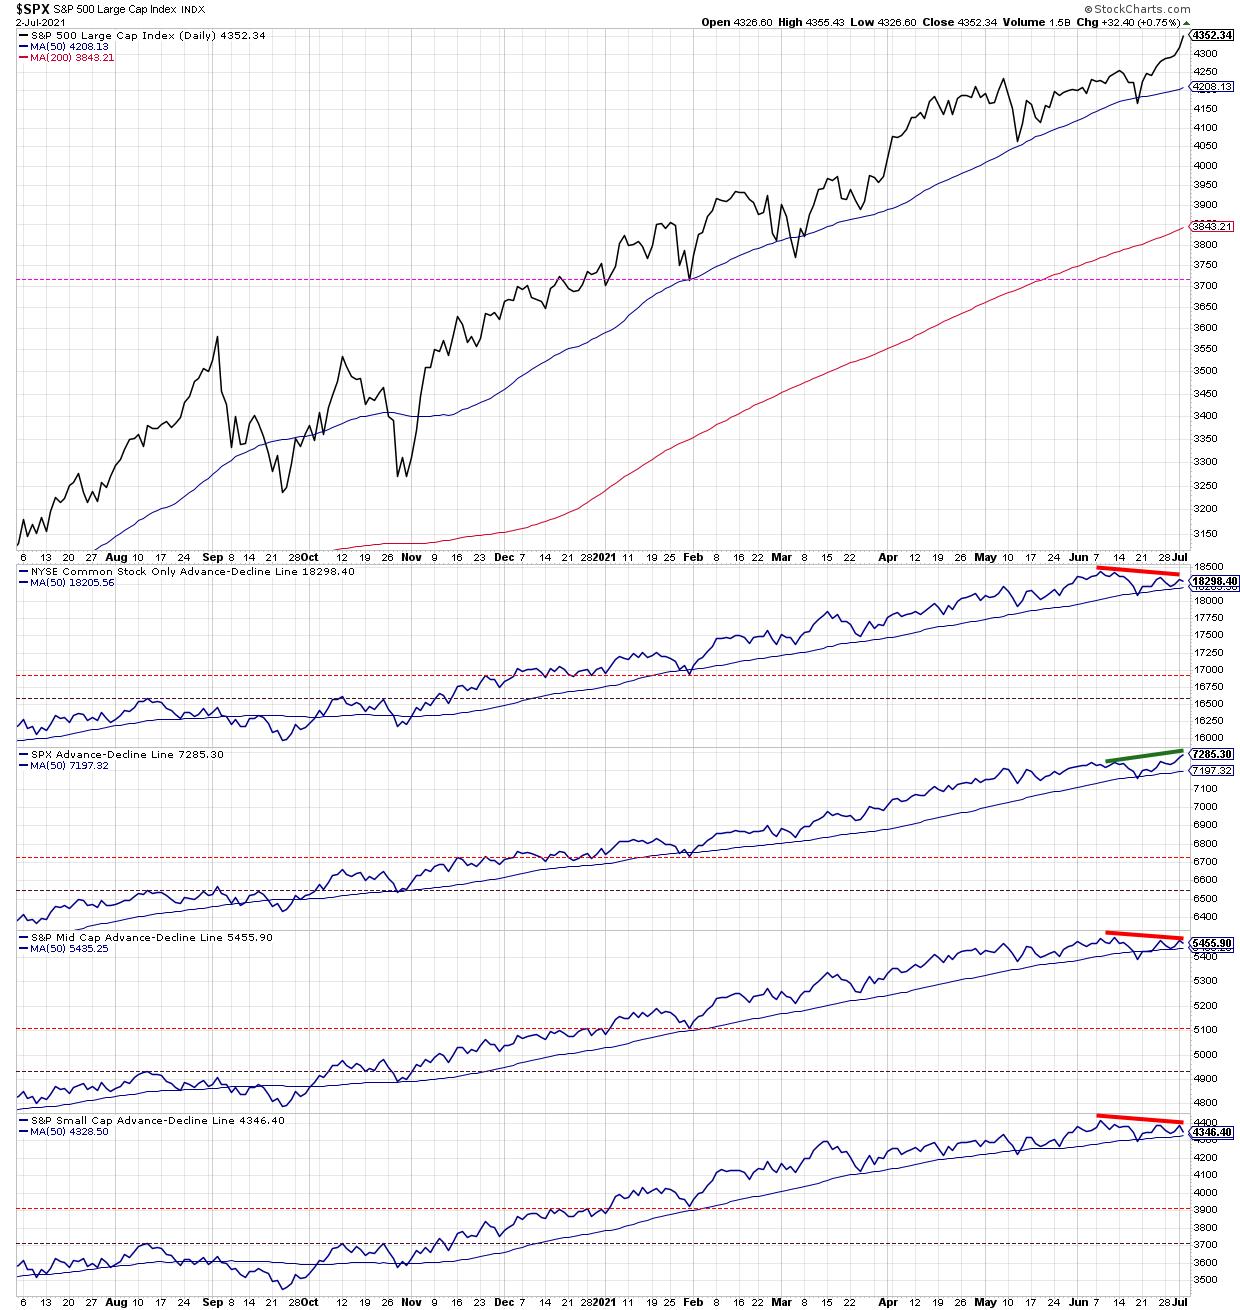
The S&P 500 and the Nasdaq Composite both closed the week in new high ground as inflation fears continue to recede... Read More
ChartWatchers July 02, 2021 at 09:31 PM
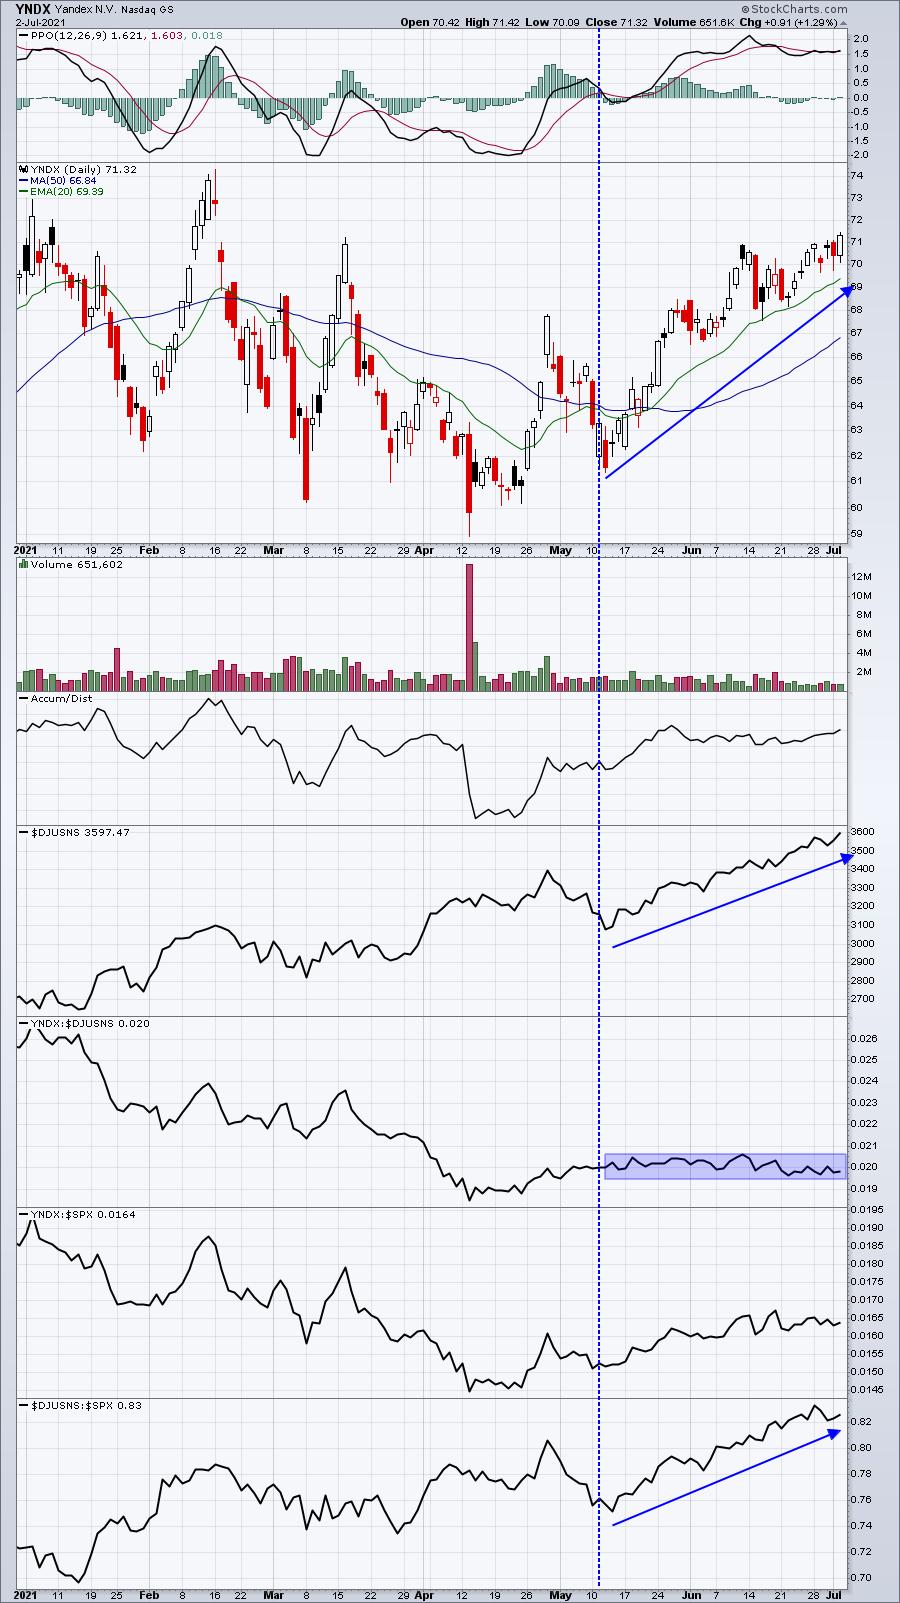
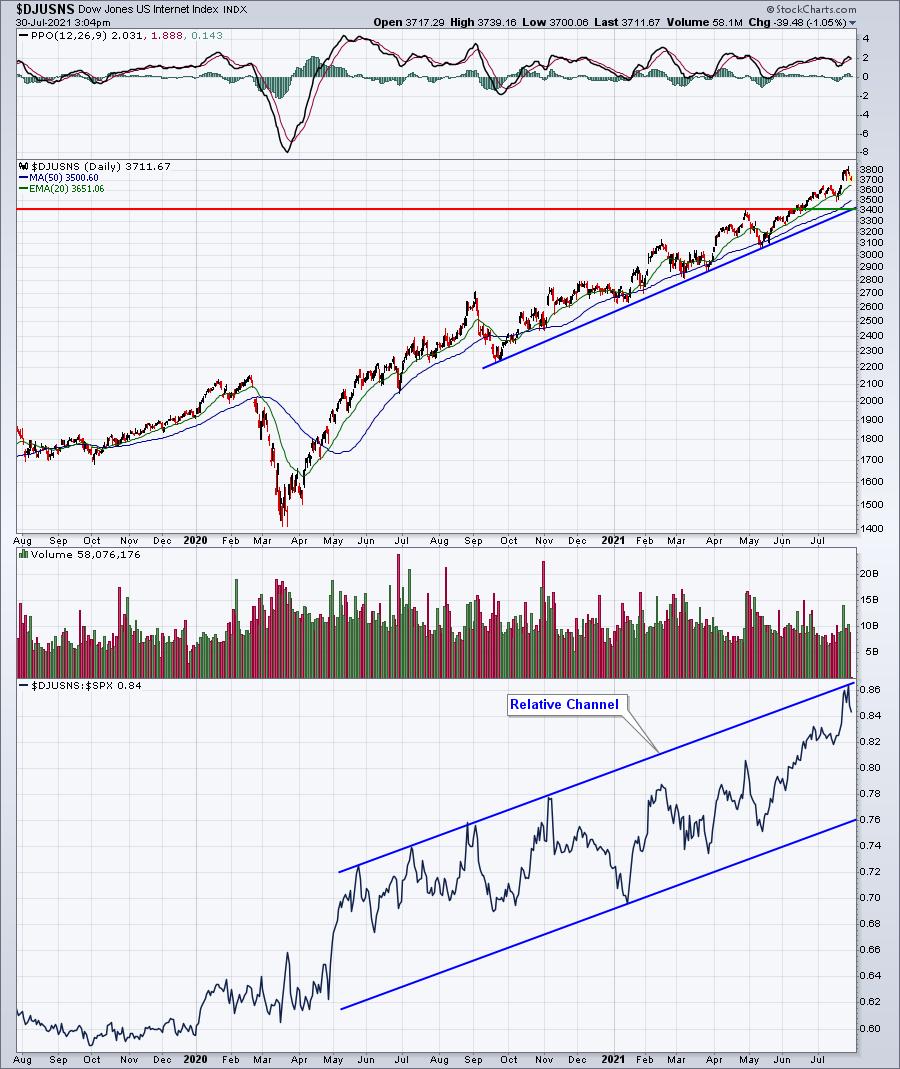
I view relative strength as one of the most important aspects of technical analysis. It helps me visualize where the money is going. When you review a price chart, it's very easy to see if a stock is going up or going down. As an example, let's look at internet stocks ($DJUSNS)... Read More
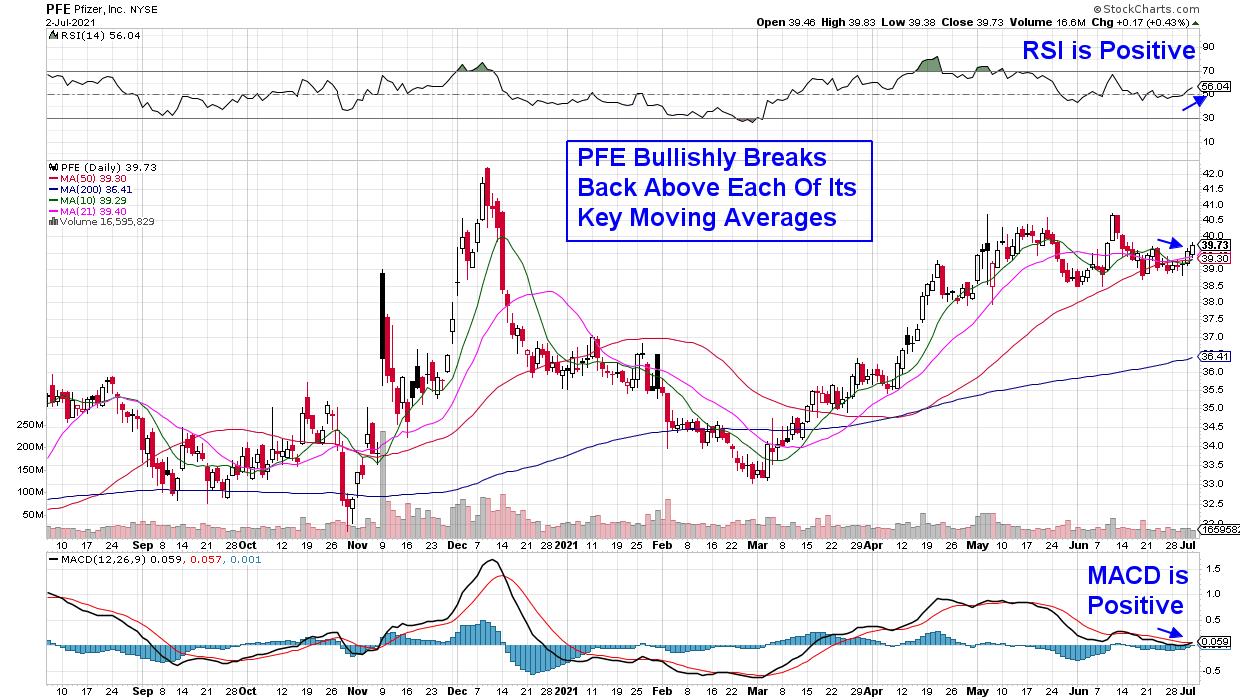
ChartWatchers July 02, 2021 at 08:42 PM
The S&P 500 is going higher. If you knew nothing else about the current market environment, you would consider that to be a bullish indication. As Paul Montgomery once said, "The most bullish thing the market can do is go up... Read More
ChartWatchers July 02, 2021 at 06:04 PM
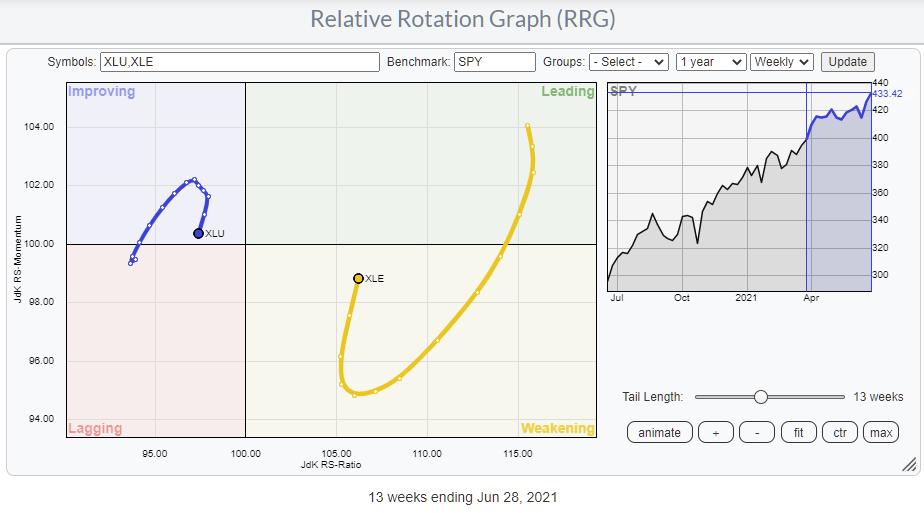
On the Sector RRG, the tails for Energy and Utilities stand out. The Utilities sector is positioned inside the improving quadrant, but started rolling over a few weeks ago and is now heading towards the lagging quadrant again... Read More
ChartWatchers July 02, 2021 at 04:01 PM
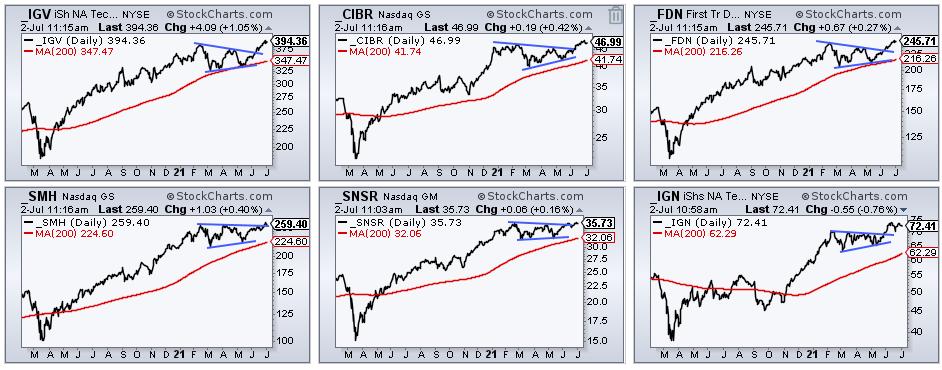
After leading the market into February 2020, tech-related ETFs were hit with strong selling pressure into March and extended their corrections into May... Read More