ChartWatchers September 24, 2021 at 11:48 PM
While the S&P 500 and the Nasdaq 100 (QQQ) are in striking distance of their early September highs in price, over 20% of the Large Cap stocks within these Indices are in a bear market.* That is to say, they're down at least 20% from their 52-week highs... Read More
ChartWatchers September 24, 2021 at 08:03 PM

Climax analysis is something unique to DecisionPoint and we've found that "climax days" are highly accurate in determining market bottoms and tops in the very short term... Read More
ChartWatchers September 24, 2021 at 07:11 PM
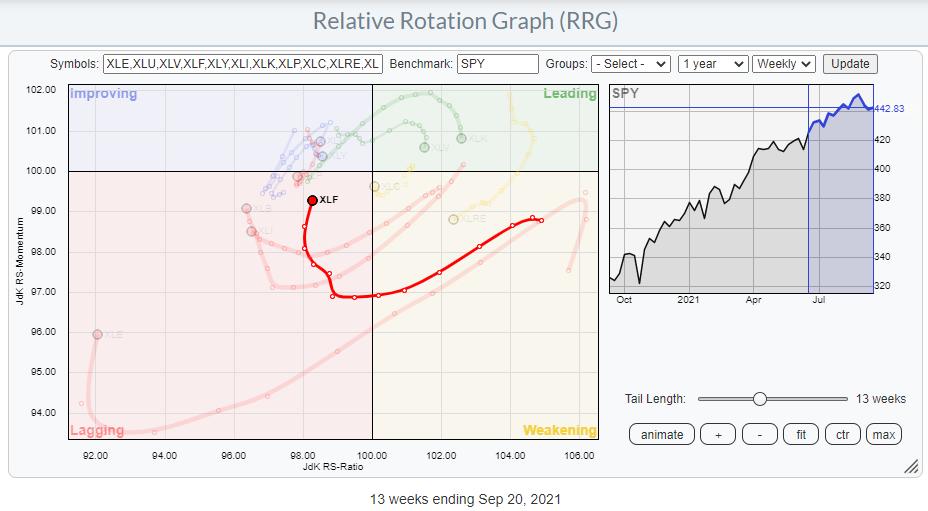
On the Relative Rotation Graph for sectors, the Financials sector, XLF, is positioned inside the lagging quadrant and heading upwards to the improving quadrant. The sector is gaining on the vertical JdK RS-Momentum axis, but not so much (yet) on the horizontal Jdk RS-Ratio axis... Read More
ChartWatchers September 24, 2021 at 02:30 PM
As you probably know, my background is in public accounting. I practiced as a CPA for two decades prior to turning my full attention to technical analysis... Read More
ChartWatchers September 17, 2021 at 10:54 PM
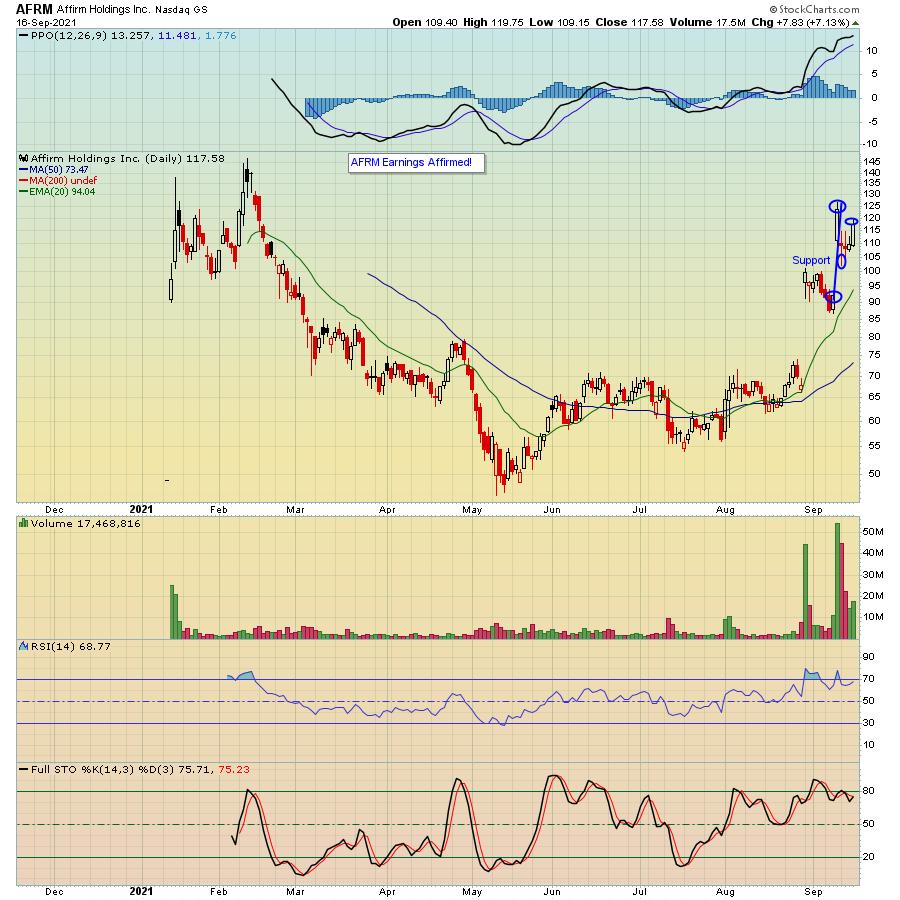
On September 9, Affirm Holdings (AFRM) reported its earnings results after the bell. The market liked what they heard and saw, with the stock climbing a nifty 37.5% from the prior day's close to the high the day after the numbers were released... Read More
ChartWatchers September 17, 2021 at 07:52 PM
A theme is emerging in the energy space. Oddly, it is not a theme focused on green energy. At this point, it appears to be a theme focused on the energy squeeze that is right before us. This worldwide issue appears to be coming to a head... Read More
ChartWatchers September 17, 2021 at 05:31 PM

The AAII indicators are making waves this week so I will cover two charts. AAII percent bears surged to 39.3% and percent bulls dropped to 22.40%. As a result, net bull-bear percentage plunged to -16.90%, the first negative reading since September 2020... Read More
ChartWatchers September 11, 2021 at 12:06 AM
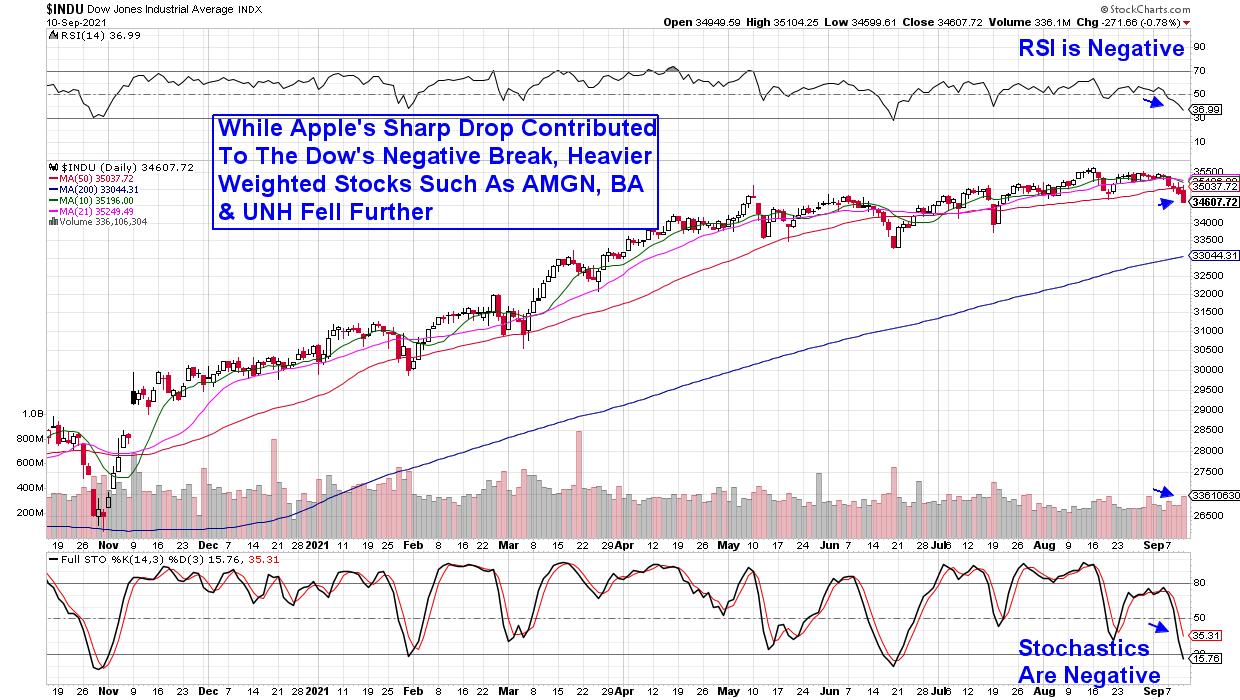
The S&P 500 posted its worst week since February, with every sector ending in the red. The move points to investor concerns about volatility as we head into the typically difficult fall period... Read More
ChartWatchers September 10, 2021 at 09:57 PM
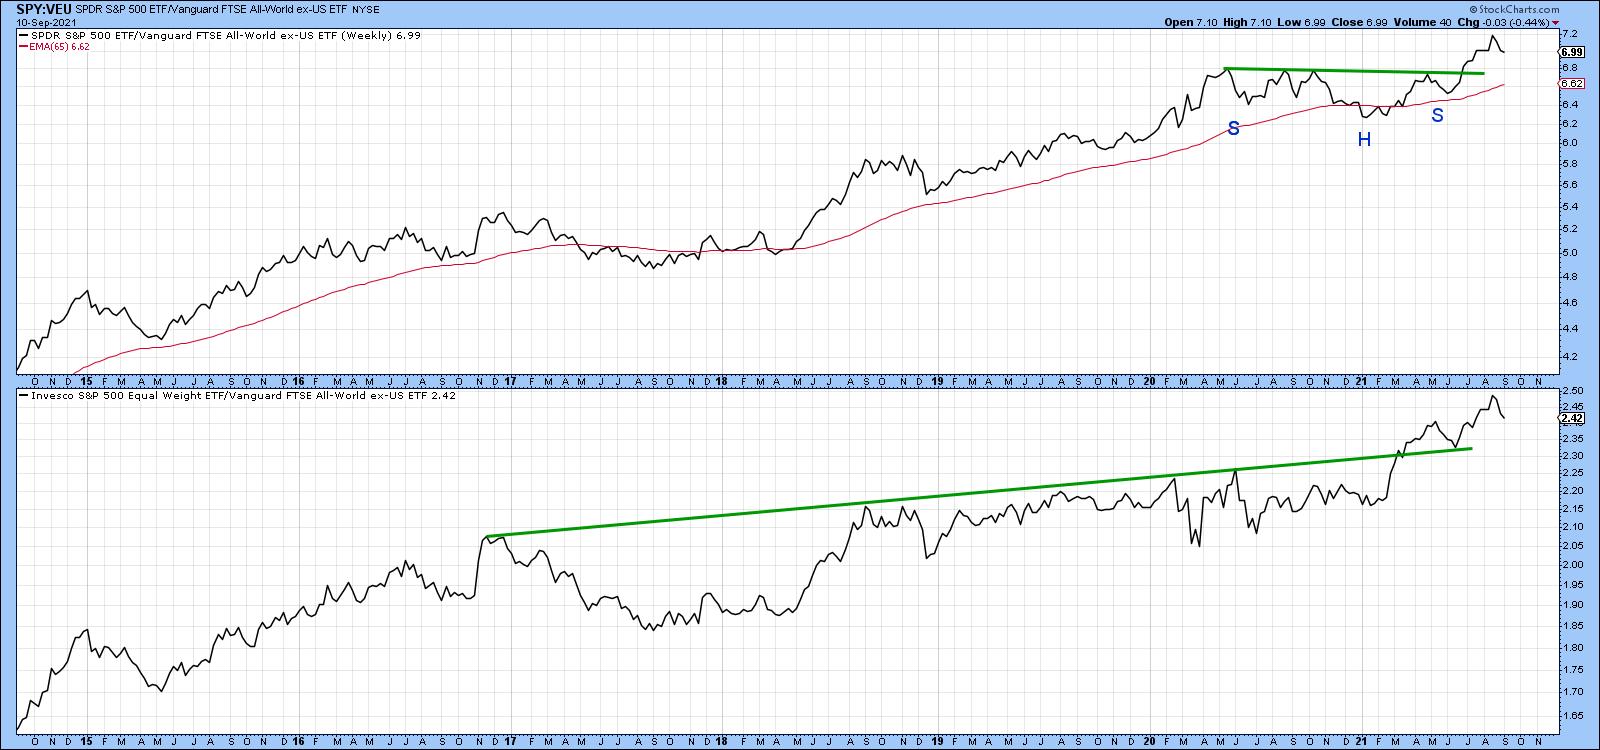
Chart 1 shows that the US stock market is in a long-term uptrend relative to the rest of the world. The upper window compares the S&P to the Vanguard All-World ex-US ETF and indicates a recent breakout from a consolidation reverse head-and-shoulders... Read More
ChartWatchers September 10, 2021 at 09:37 PM
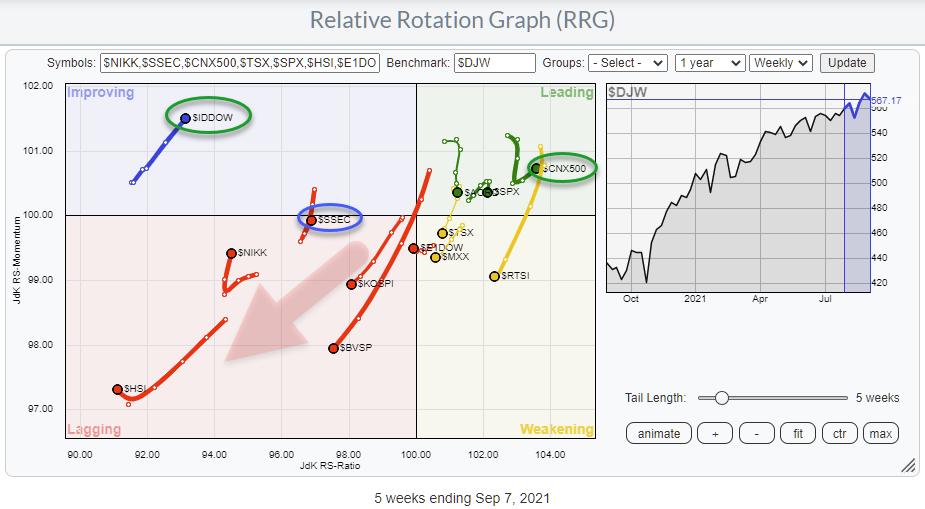
With the SPY/SPX chart sending curveballs, sector rotation on Relative Rotation Graphs is sending conflicting signals. With breadth continuing to deteriorate as the S&P continues to creep higher, getting a handle on the markets is not getting any easier... Read More
ChartWatchers September 10, 2021 at 02:30 PM
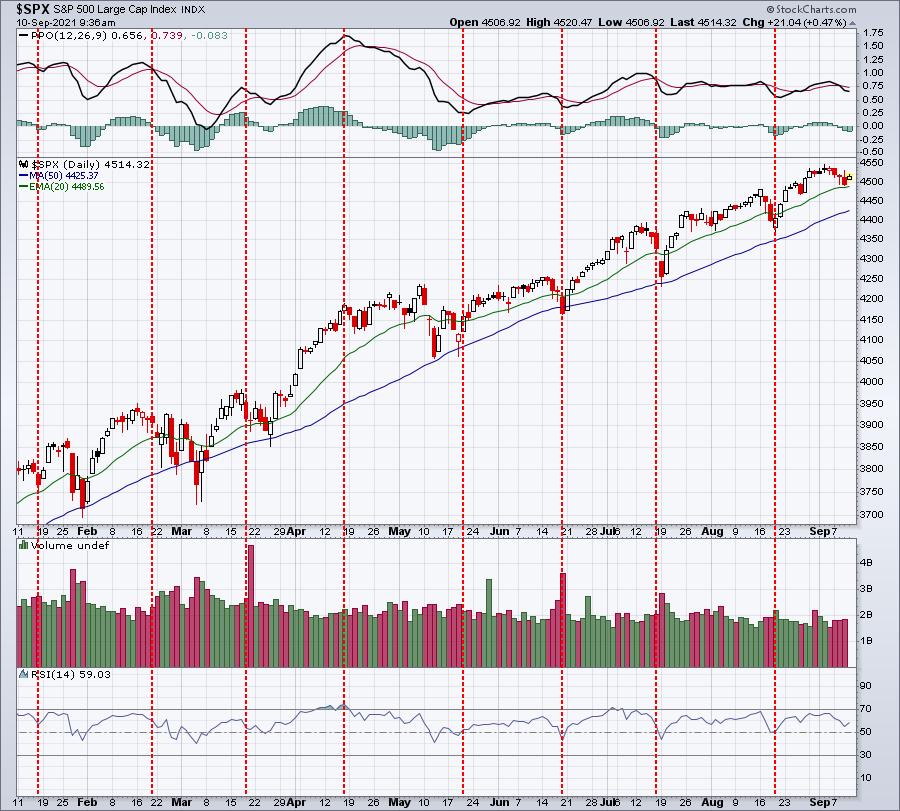
Congratulations! We've made it through the first 10 days of September mostly unscathed. At the time of this writing, the S&P 500 is down slightly more than 0.50% month-to-date... Read More
ChartWatchers September 03, 2021 at 08:54 PM
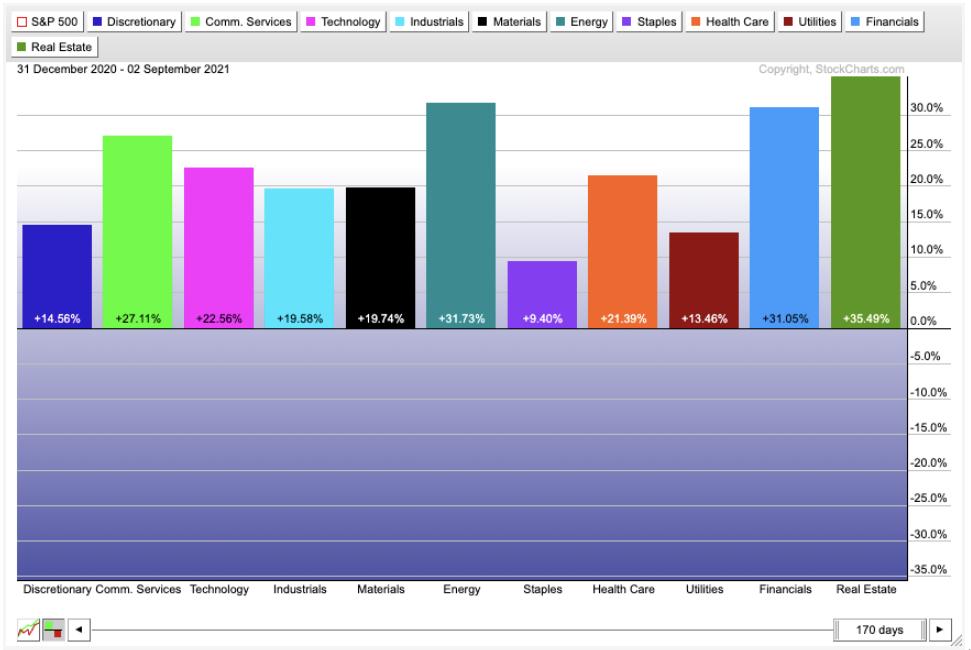
Tech gets all the press these days, as the Energy sector is so small in the SPX weighting. However, it is the second-best sector to produce some of the stunning returns year-to-date... Read More
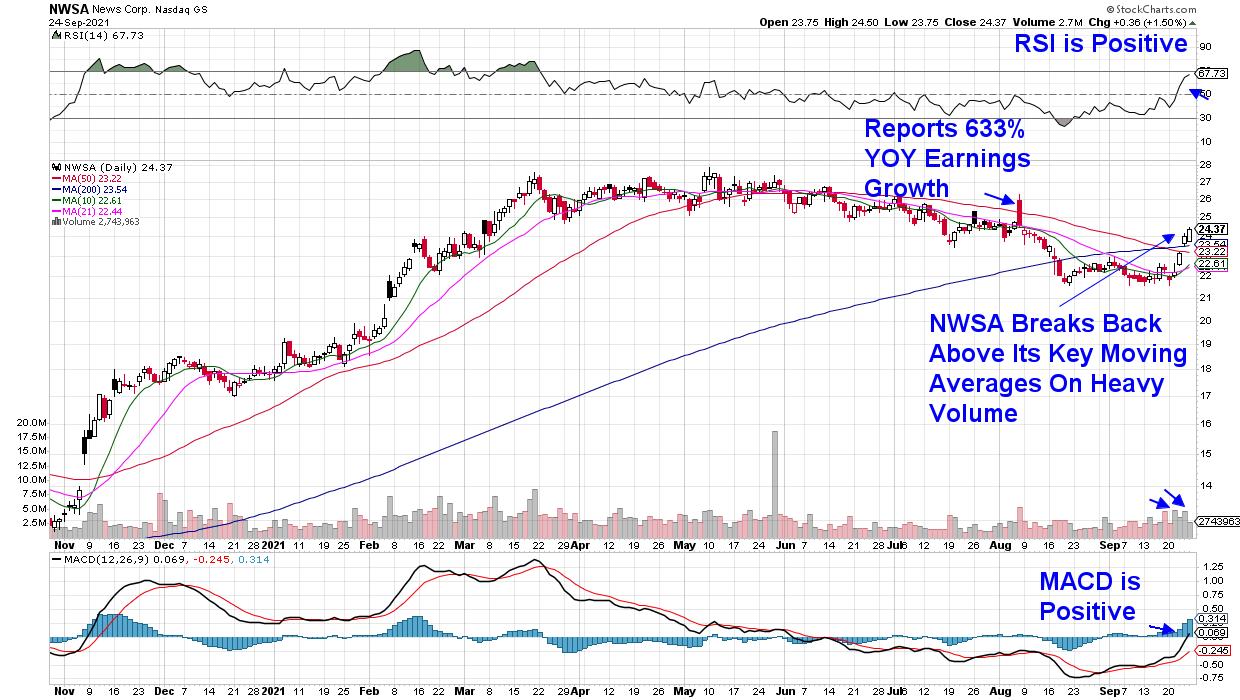
ChartWatchers September 03, 2021 at 07:19 PM
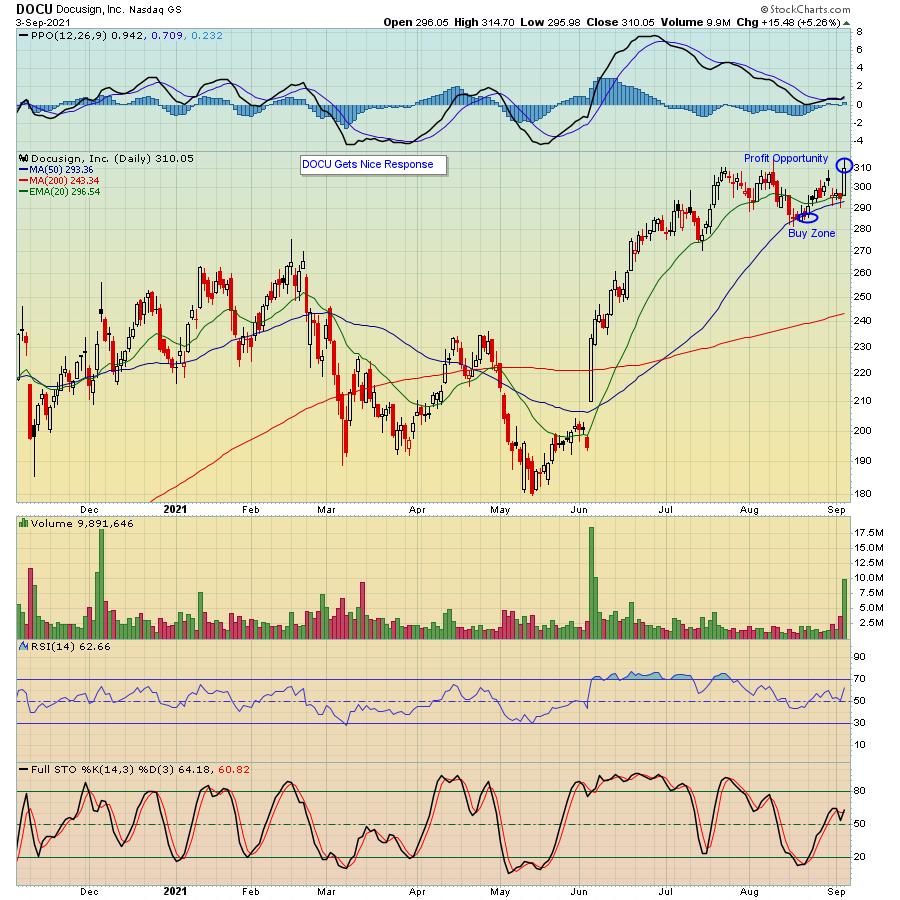
For a very long time, I have avoided holding stocks that I own into an earnings report. I should explain that I am more of a short-term trader, so I don't like the risk that goes along with holding a stock when they are about to report... Read More
ChartWatchers September 03, 2021 at 11:32 AM

Today's commentary will start with price chart analysis for a clean energy ETF, which once led the market with triple digit gains. After a corrective period, it appears that this high flying ETF and a few of its brethren are turning up again with recent trend signals... Read More