ChartWatchers April 29, 2022 at 07:03 PM
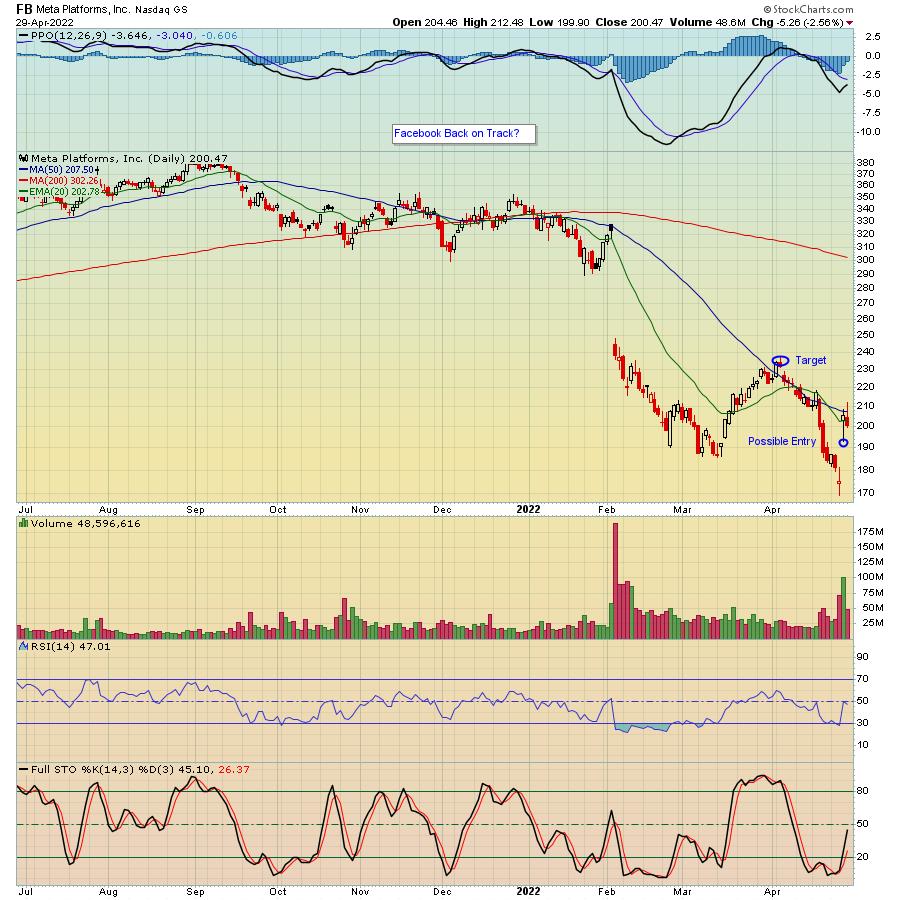
Over the past two weeks, we have heard from many of the most visible companies in the world, including the FAANG stocks, Facebook (FB), Amazon (AMZN), Apple (AAPL), Netflix (NFLX) and Google (GOOGL), who reported their Q1 earnings... Read More
ChartWatchers April 29, 2022 at 06:17 PM
I need to add a new word to my trading vocabulary. I think every presentation at this year's CMT Association Symposium has used "regime change" to define the shift from one leading sector to another leading sector... Read More
ChartWatchers April 29, 2022 at 04:43 PM
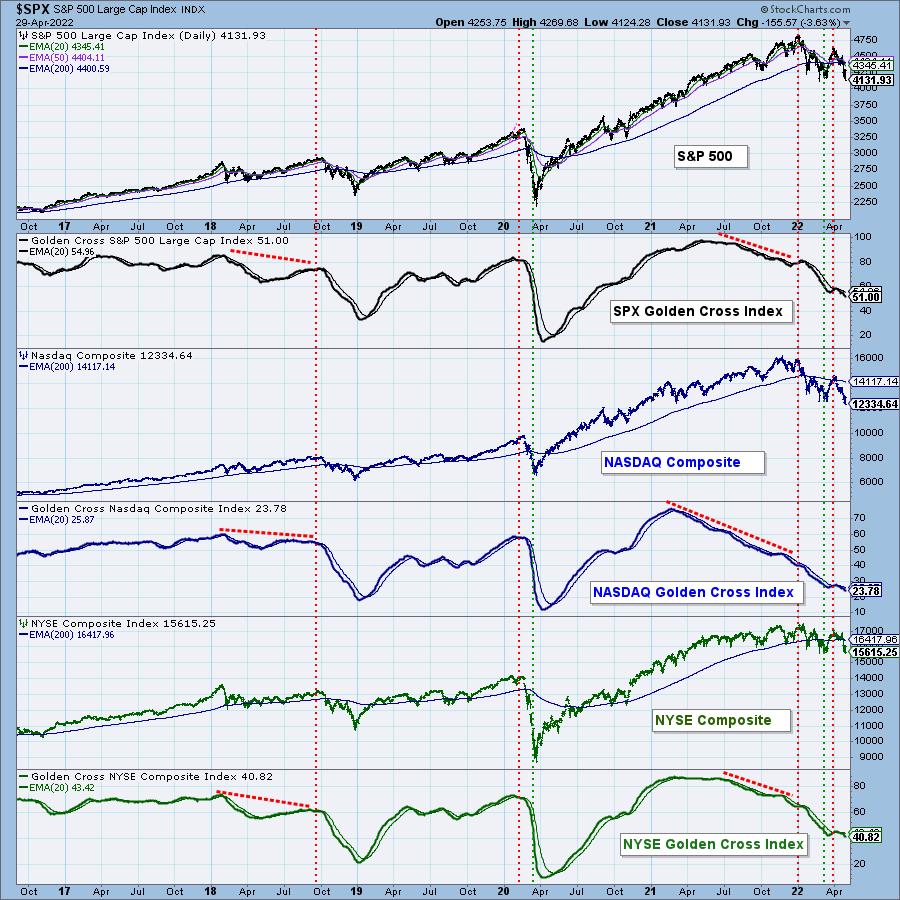
The Golden Cross Index (GCI) and Silver Cross Index (SCI) give a much better picture of market breadth than any advance-decline based indicator... Read More
ChartWatchers April 23, 2022 at 12:57 AM
Ok, I was being a bit dramatic. The Dow Jones Industrial Average only dropped 981 points on Friday, not 1000. But it was another reminder that this bear market has not ended. In fact, I believe the short-term signals are pointing to much more weakness ahead... Read More
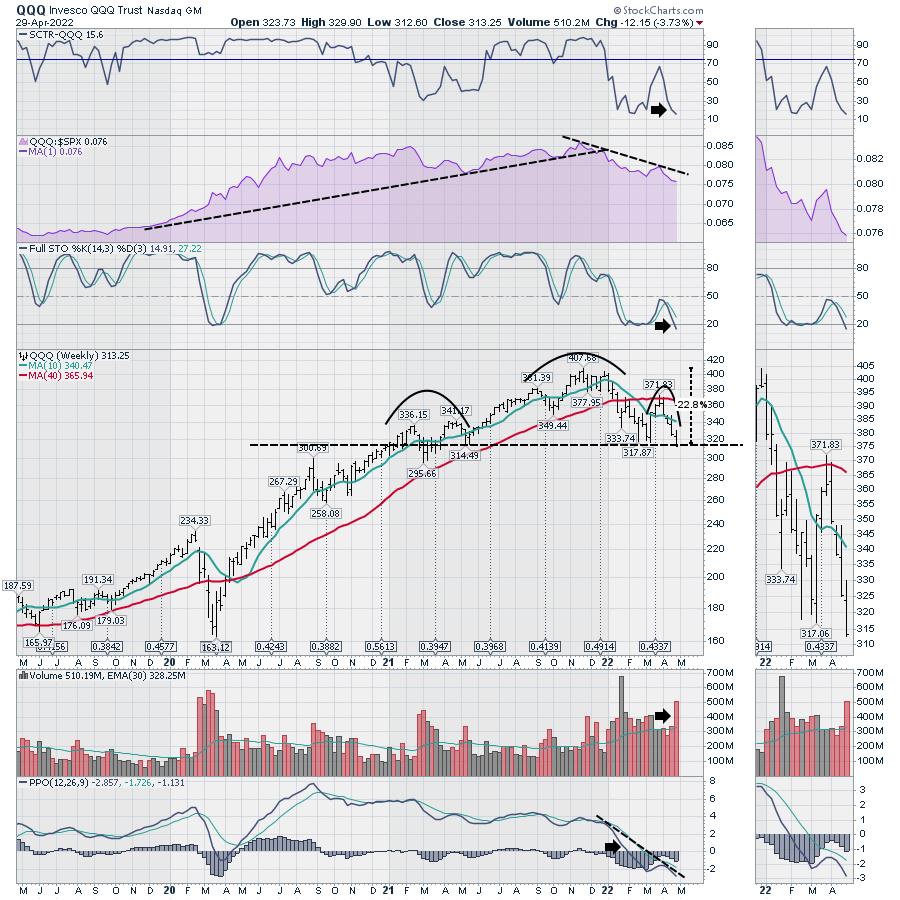
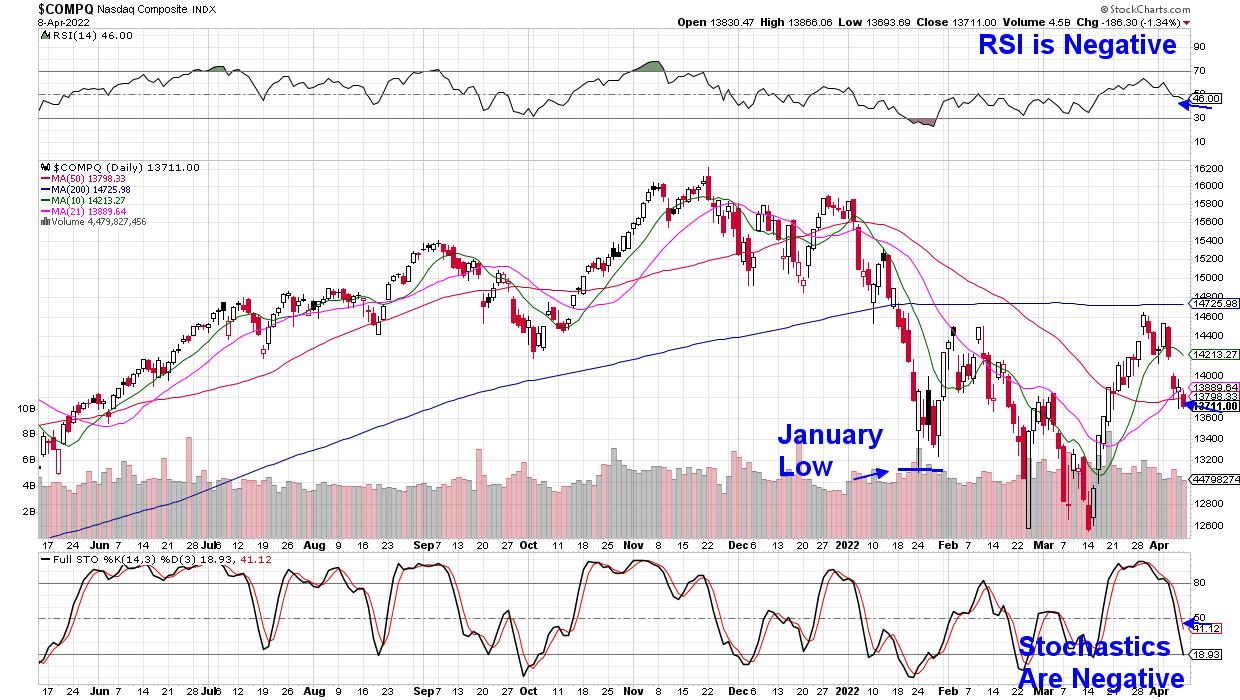
ChartWatchers April 23, 2022 at 12:06 AM
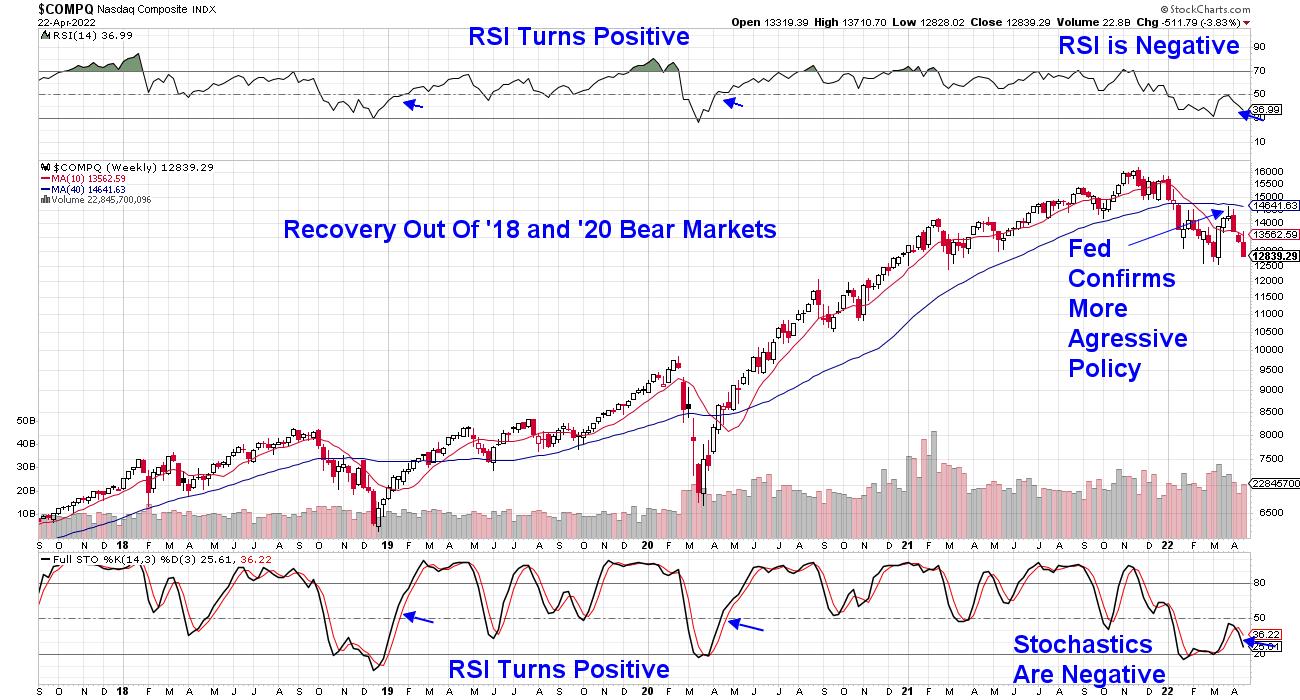
The Nasdaq has re-entered a bear market after last week's drop put this index 20.4% below its November high in price. At this time, the index is 2.6% above its next area of downside support, which is its February lows... Read More
ChartWatchers April 22, 2022 at 10:45 PM
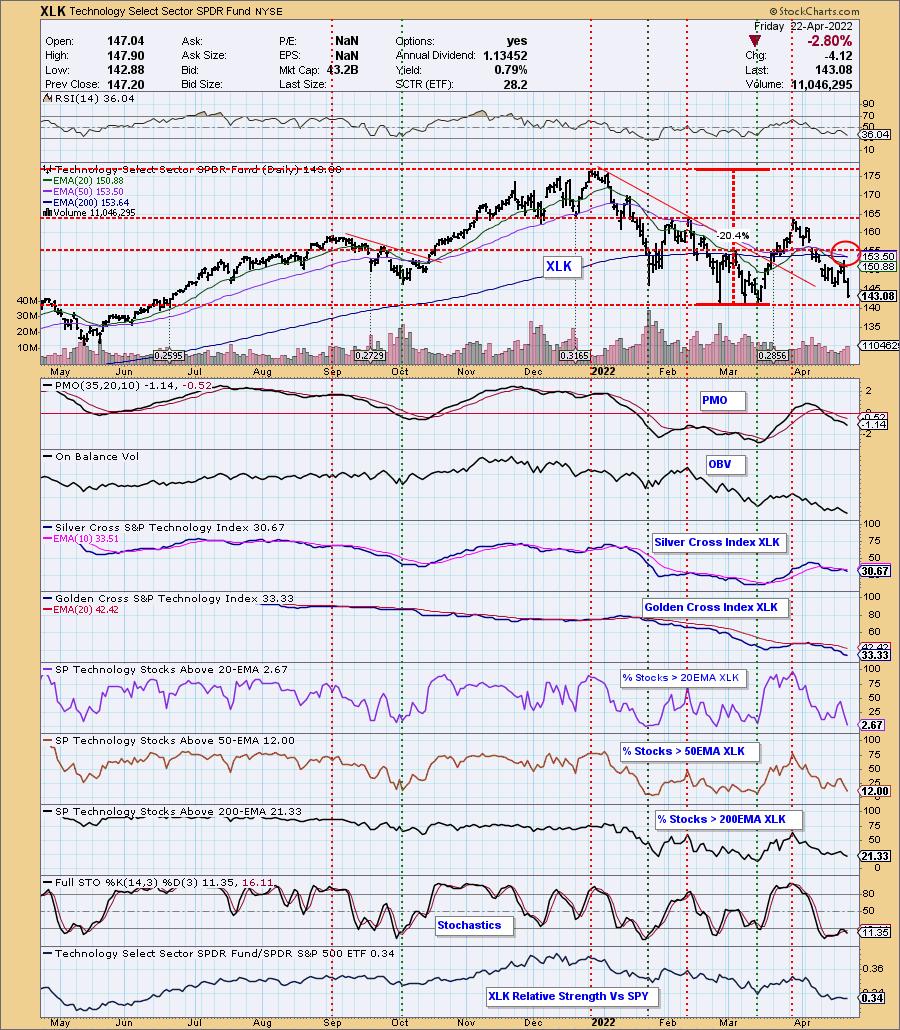
The following is an excerpt from this week's subscriber-only DecisionPoint ALERT Weekly Wrap. Today, the Technology Sector (XLK) 50-day EMA crossed down through the 200-day EMA, effecting what is widely (and dramatically) known as a Death Cross... Read More
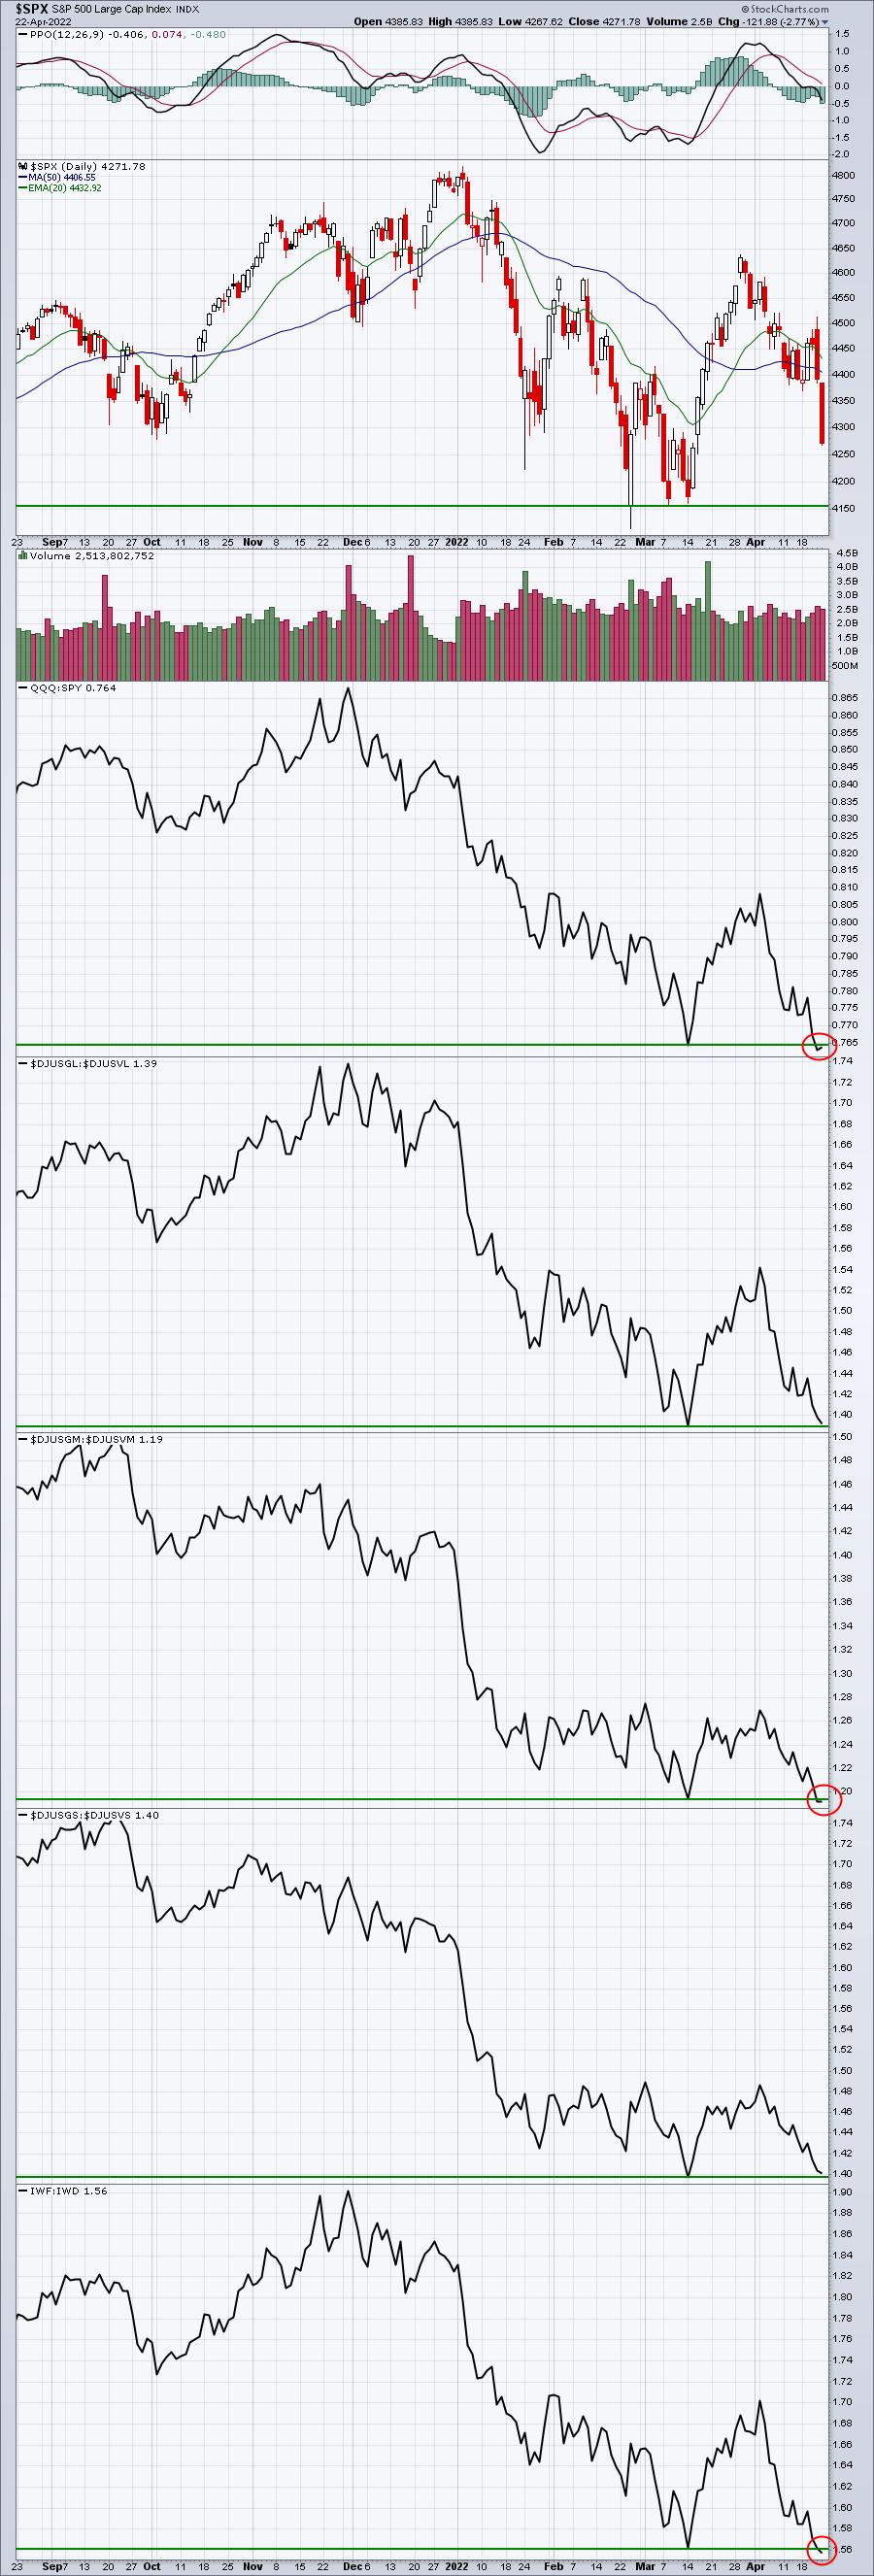
ChartWatchers April 22, 2022 at 02:52 PM
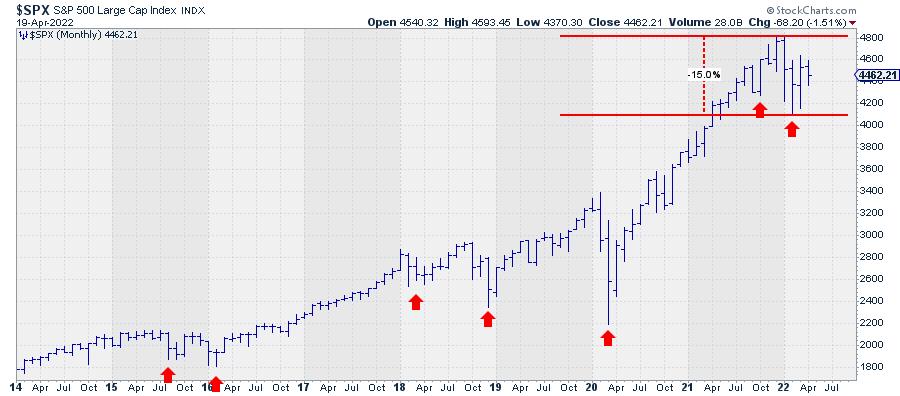
How can we ride out this bear market? Before we can answer that question, we first have to define what qualifies as a bear market. Very often, a decline of 20% or more from the most recent high is used as a yardstick to define a bear market... Read More
ChartWatchers April 15, 2022 at 05:36 PM

Sector PerfCharts provide clear performance snapshots of the market mood and the market mood is defensive. The PerfCharts below show the percentage change for the S&P 500 SPDR (SPY) and the eleven sectors... Read More
ChartWatchers April 15, 2022 at 05:18 PM
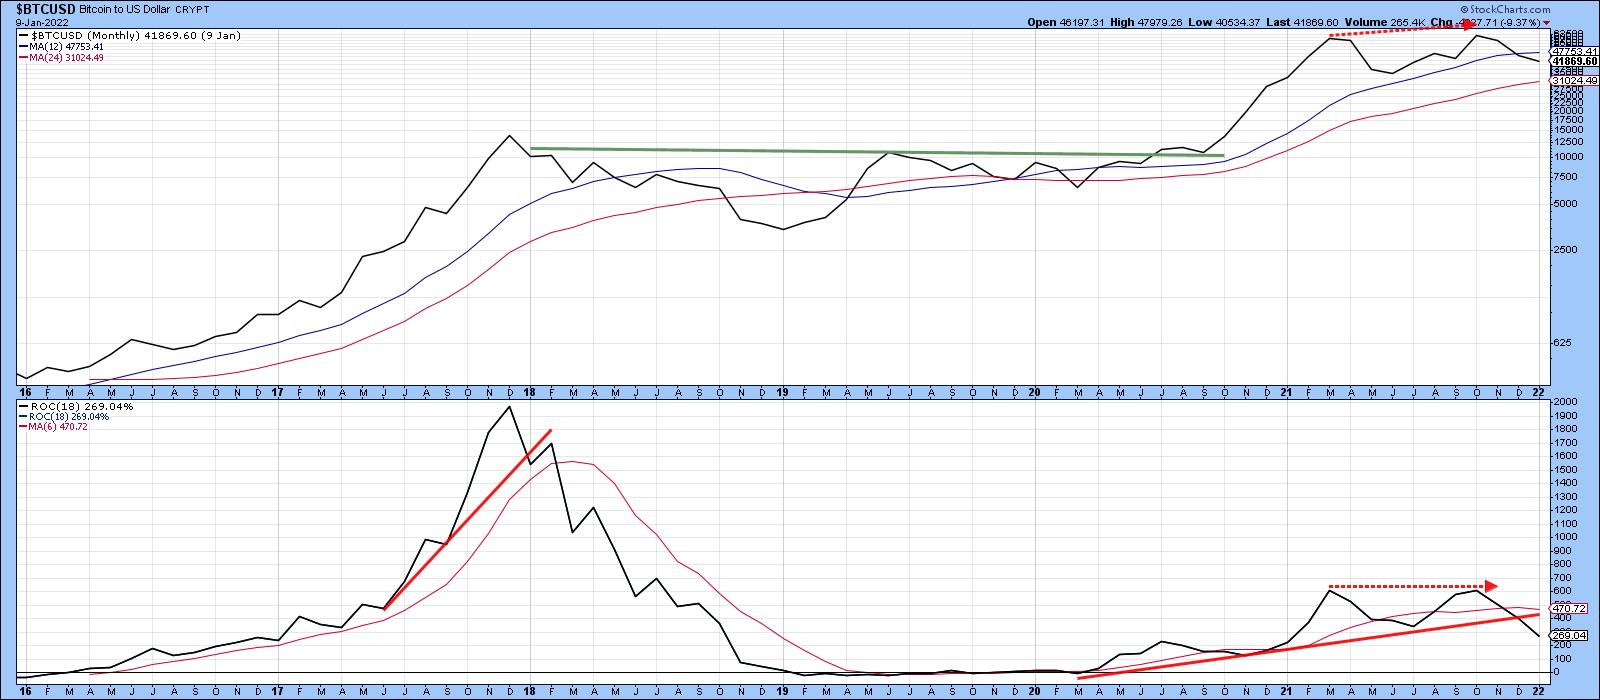
In early December of last year, I wrote an article on whether Bitcoin had reached the tipping point in terms of signaling a peak in the crypto bubble... Read More
ChartWatchers April 15, 2022 at 03:01 PM
It's that time of the year, Q1 Earnings Season, when thousands of companies reveal their numbers, including the good, the bad and the ugly... Read More
ChartWatchers April 15, 2022 at 02:27 PM
It's been a difficult year for investors focused on what used to be working. I've noticed a small, subtle trend that has started to emerge at the beginning of each month. It has been focused towards the Nasdaq, but financials and consumer discretionary have also been hit... Read More
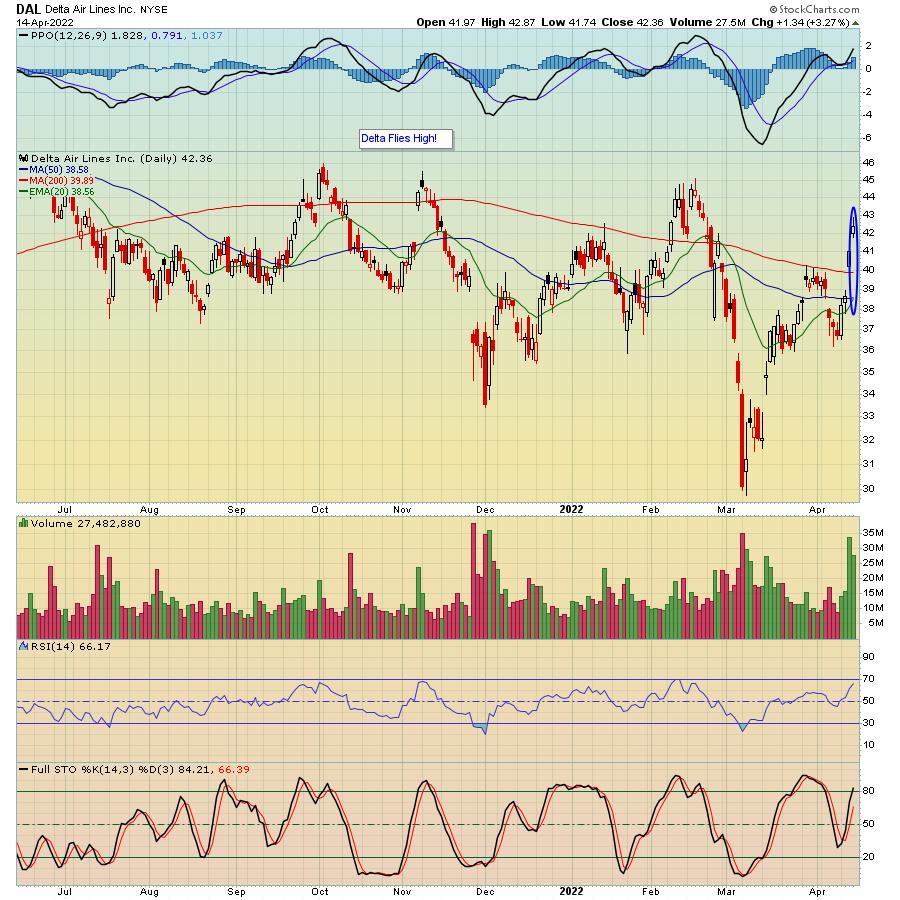
ChartWatchers April 08, 2022 at 10:10 PM
The Federal Reserve's confirmation that they'll be taking an aggressive stance with their monetary policy to fight inflation, halted an emerging downtrend reversal in the markets... Read More
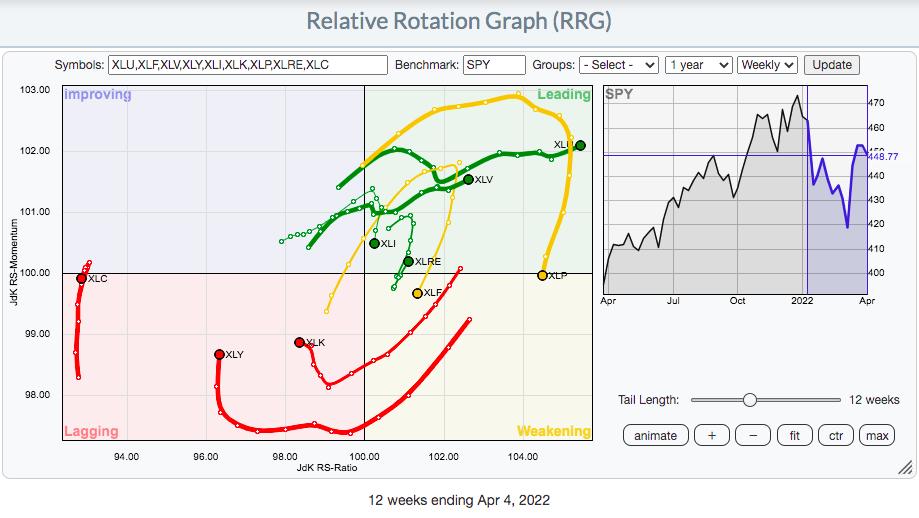
ChartWatchers April 08, 2022 at 02:52 PM
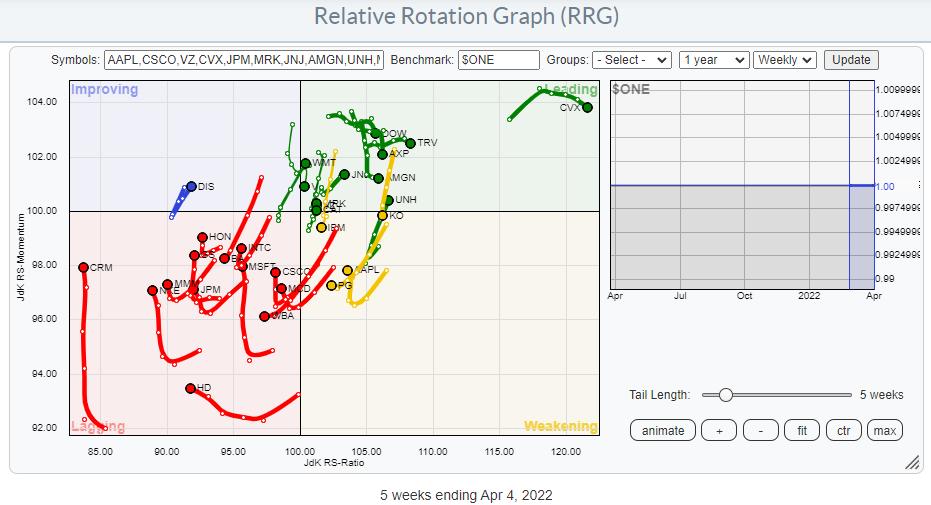
The Relative Rotation Graph above shows the members of the DJ Industrials index against $ONE as the benchmark. This way of looking at RRG helps us to gauge the price trends within the universe... Read More
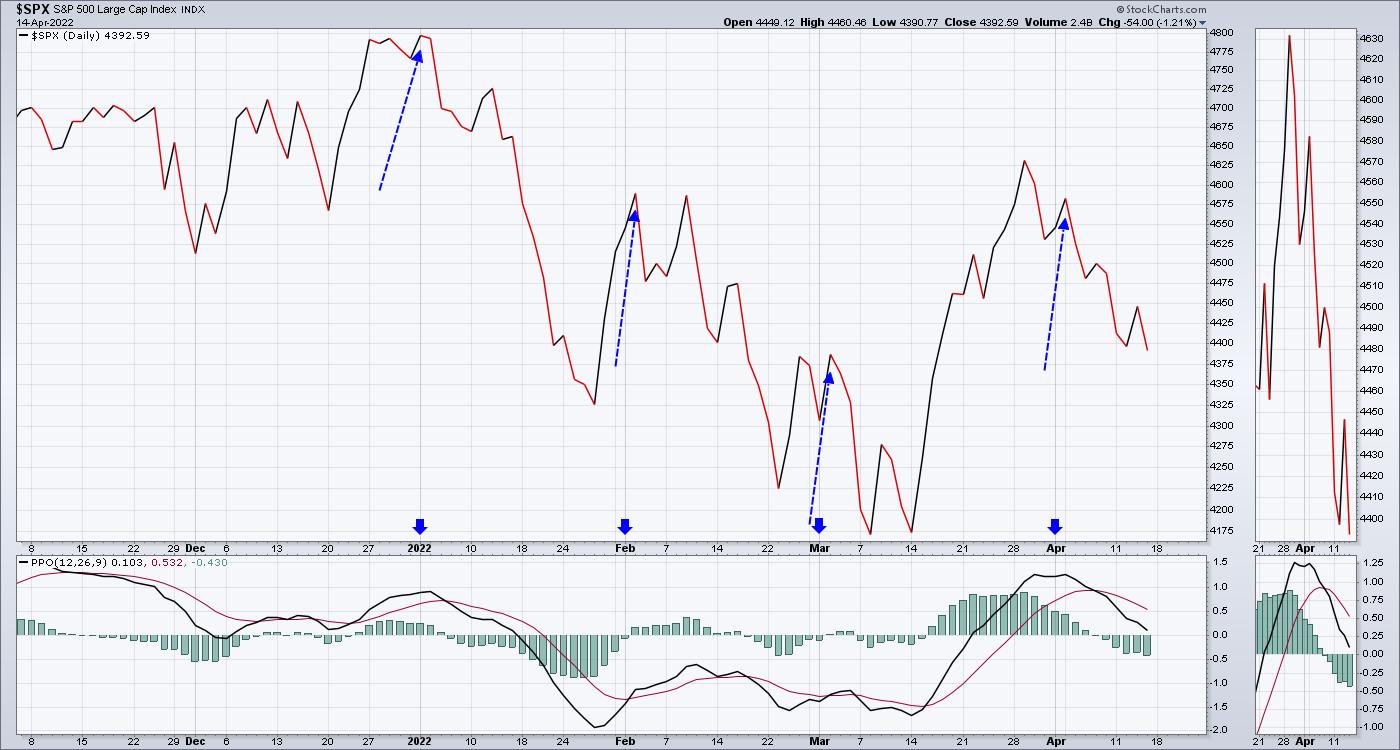
ChartWatchers April 08, 2022 at 11:49 AM
We've rallied a TON off the February low, which is certainly encouraging... Read More
ChartWatchers April 01, 2022 at 08:09 PM
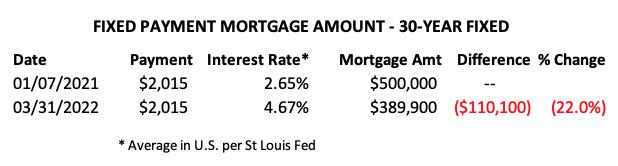
The following is an excerpt from this week's subscriber-only DecisionPoint ALERT Weekly Wrap. We have been commenting on mortgage rates for several months, and this week we finally saw a report on Fox Business that reported on the problem of rising mortgage rates... Read More
ChartWatchers April 01, 2022 at 07:34 PM
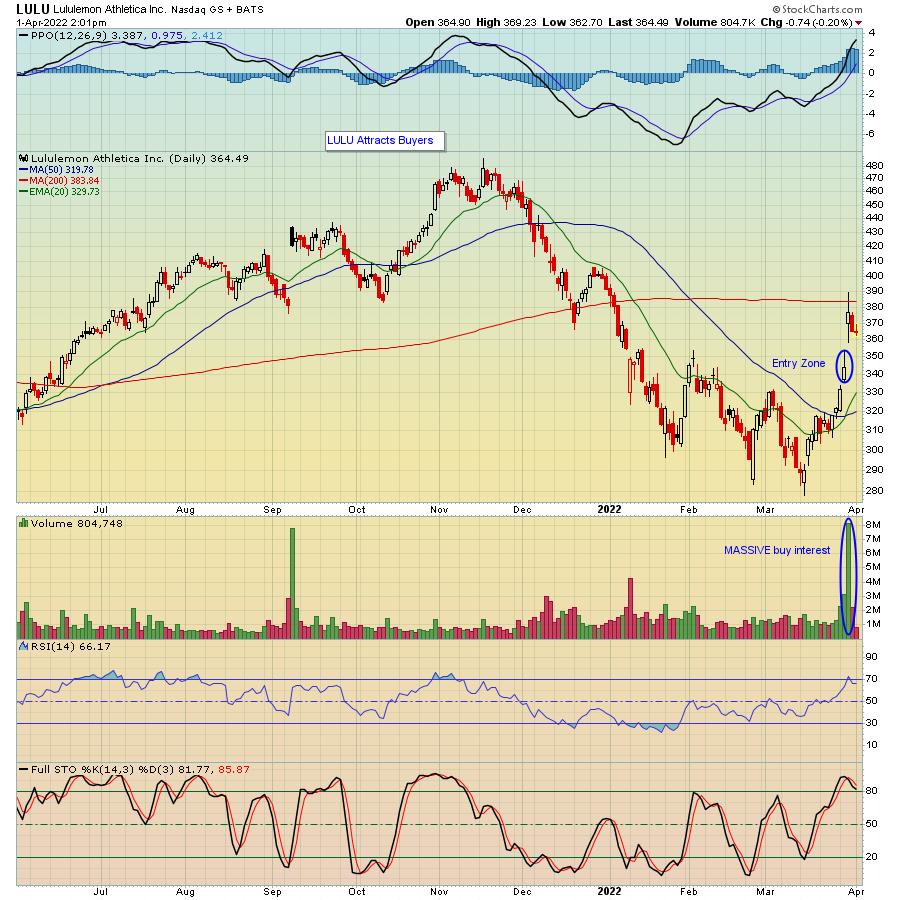
In this extremely volatile market, it pays to develop a trading strategy that can work in any market environment... Read More
ChartWatchers April 01, 2022 at 02:39 PM

Volatility is through the roof for many commodities and commodity-related ETFs, but this does not mean we have to abandon technical analysis and classic setups. High volatility does, however, imply higher risk and we probably need to give setups a little more wiggle room... Read More
ChartWatchers April 01, 2022 at 02:02 PM
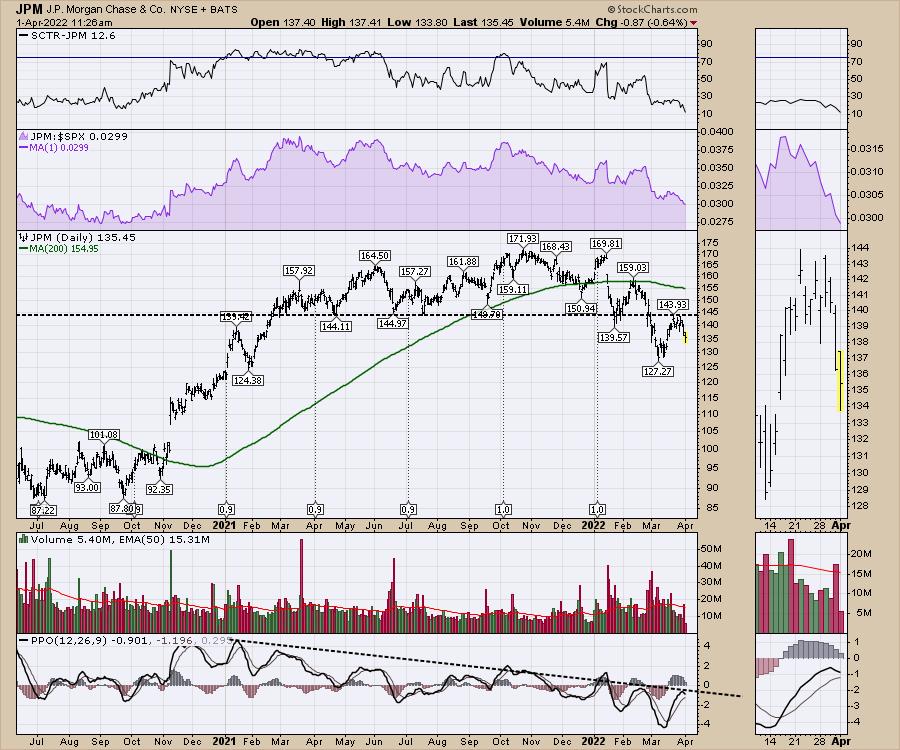
With the bank stocks moving lower, well below the 2021 range, it is an odd "rebound" in the indexes. The difference between the bank price action and the indexes is starting to become meaningful... Read More