ChartWatchers April 24, 2020 at 11:55 PM
The broader markets continue to climb a wall of worry with an impressive bear market rally that's been able to shrug off a barrage of negative news... Read More
ChartWatchers April 24, 2020 at 09:07 PM
Editor's Note: This is an updated version of an article originally posted on Martin Pring's Market Roundup on April 21, 2020. In recent articles, I have pointed out that quite a few of the short-term indicators reached well beyond their normal oversold readings at the March lows... Read More
ChartWatchers April 24, 2020 at 06:56 PM
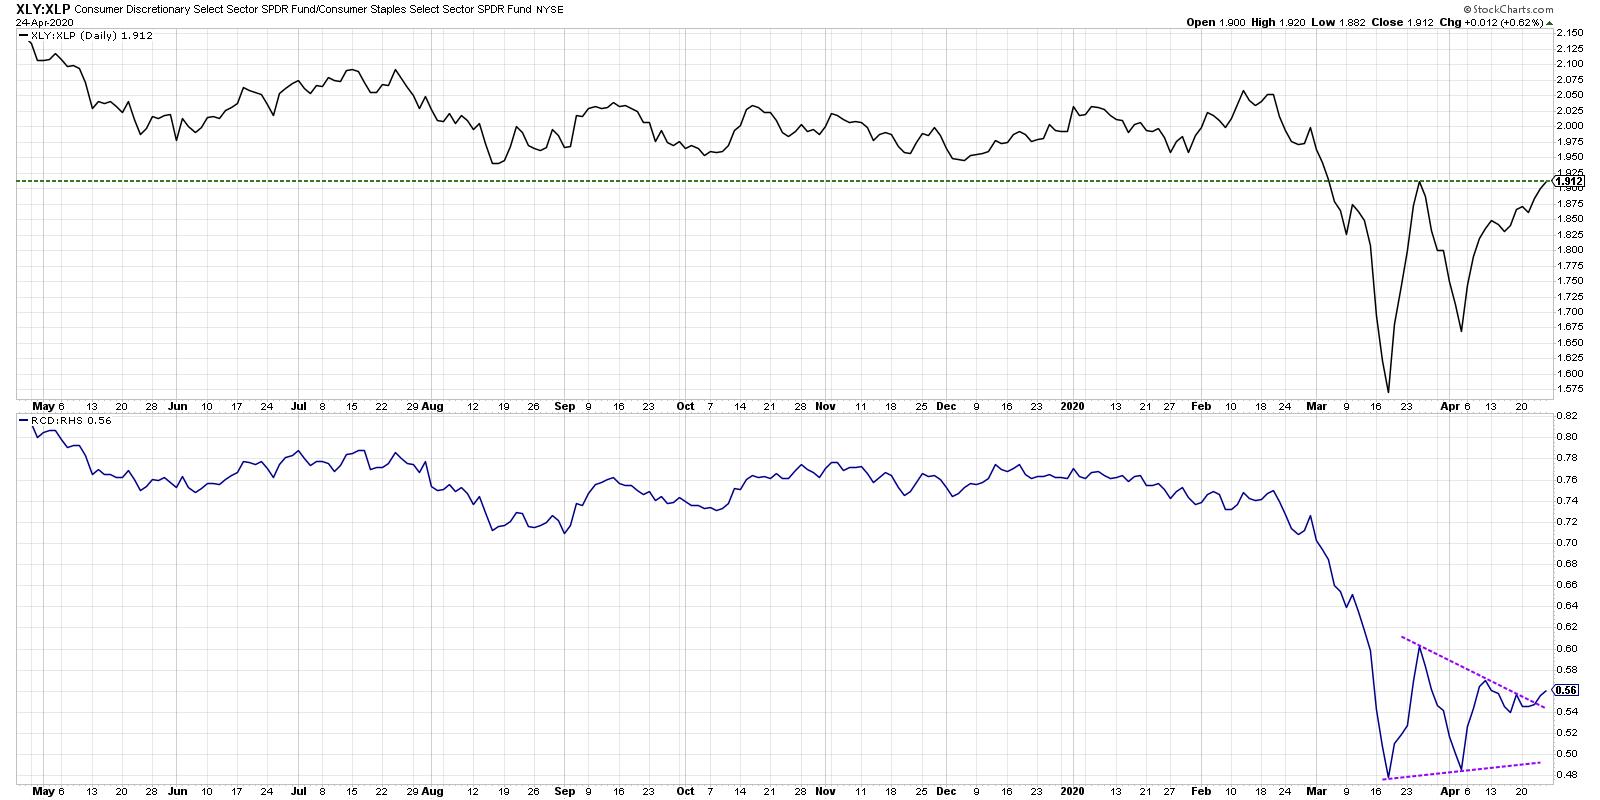
One of the ways I like to measure offensive vs. defensive pressure in the equity market is using the ratio of Consumer Discretionary to Consumer Staples... Read More
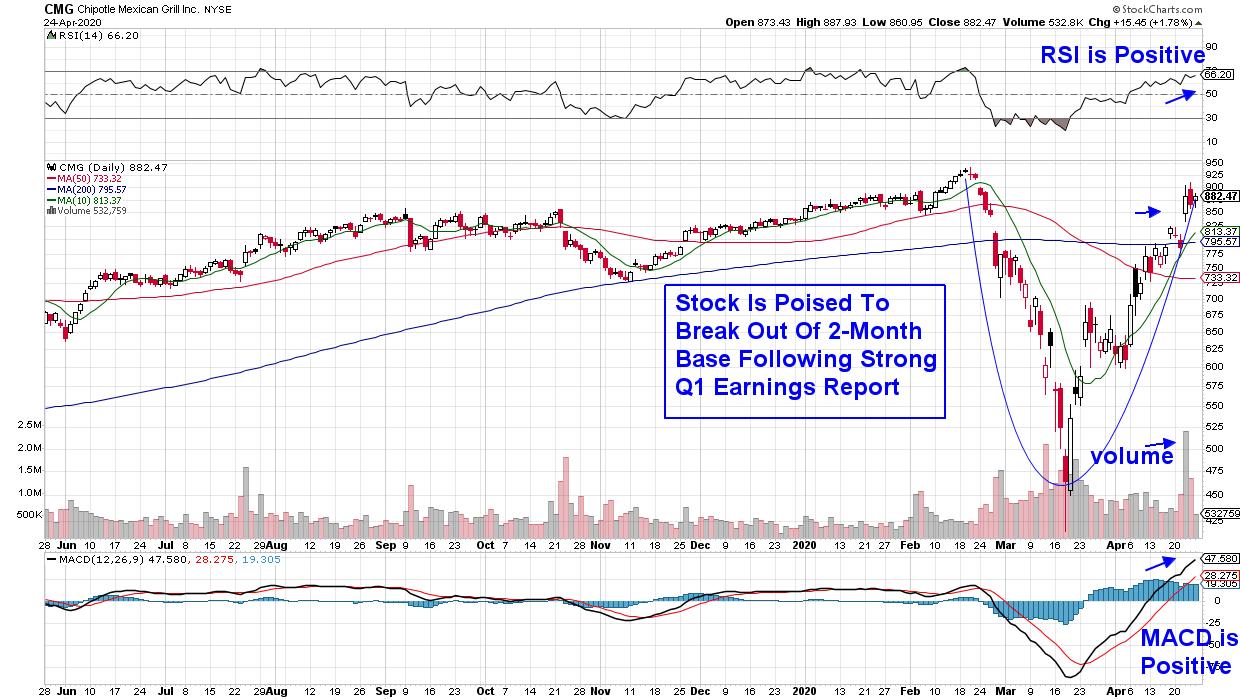
ChartWatchers April 24, 2020 at 05:44 PM
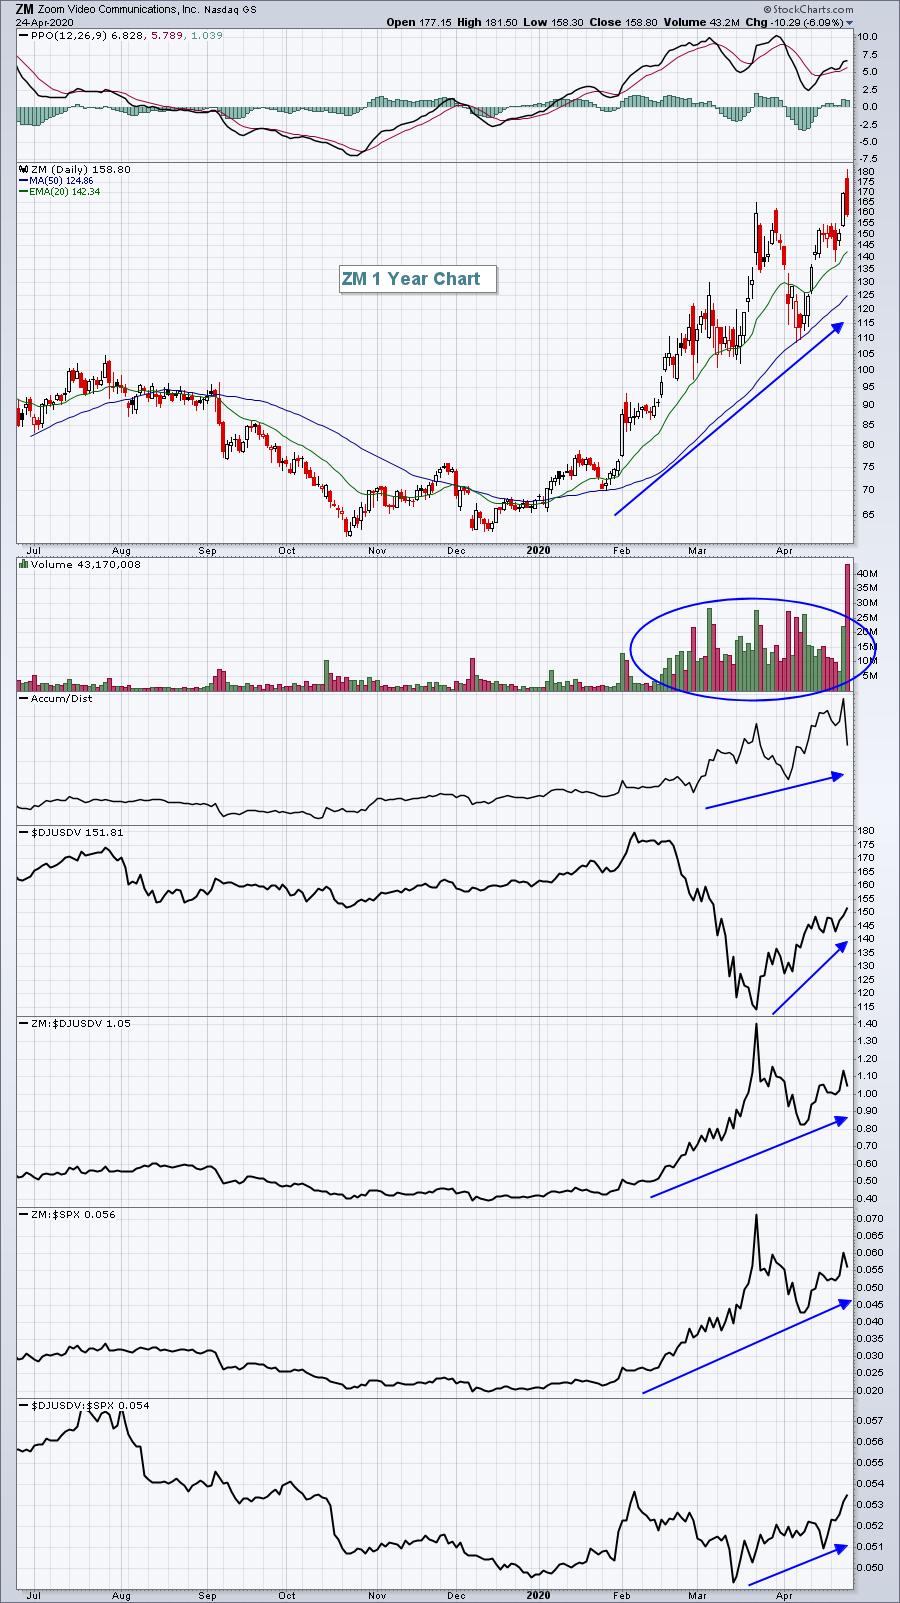
Zoom Video Communications, Inc. (ZM) broke out technically just before the start of the NFL Draft and continued its stealth move higher on Friday - that is, until Facebook (FB) announced that they wanted to join the video meeting party. ZM traded as high as 181... Read More
ChartWatchers April 24, 2020 at 01:42 PM
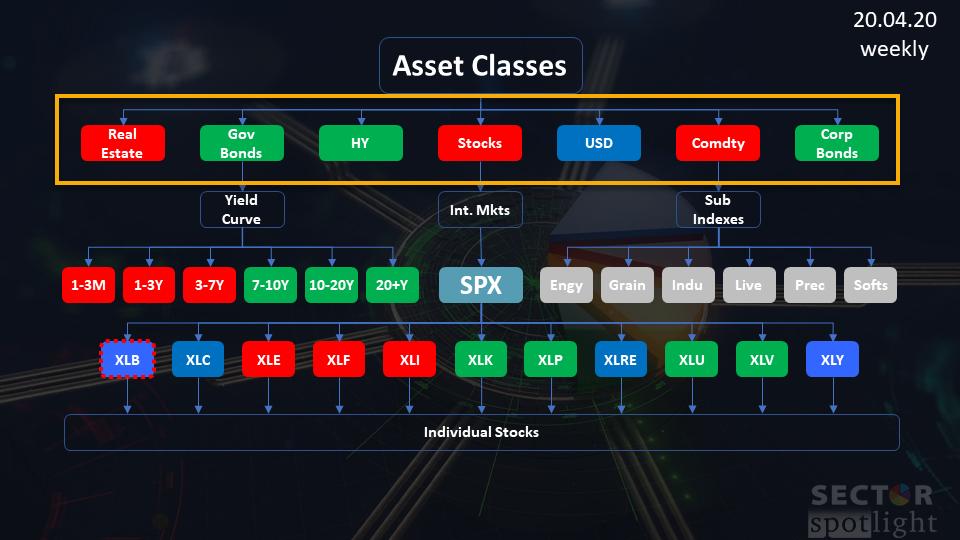
In the latest episode of my StockCharts TV series Sector Spotlight, I took an in-depth look at the relative rotation of asset classes vs. VBINX, the Vanguard Balanced Index fund, which represents a 60/40 stocks/bond portfolio... Read More
ChartWatchers April 17, 2020 at 10:18 PM
One of the more interesting phenomena this week is the separation of investors across broad areas of the market. The bulls are firmly in the bull camp, with no retest of the lows expected. The bears are firmly in the bear camp and expect the market to fall... Read More
ChartWatchers April 17, 2020 at 09:04 PM
While co-hosting the WealthWise Women show with me yesterday, Mary Ellen McGonagle said something that got my attention and filled me with intrigue... Read More
ChartWatchers April 17, 2020 at 09:00 PM
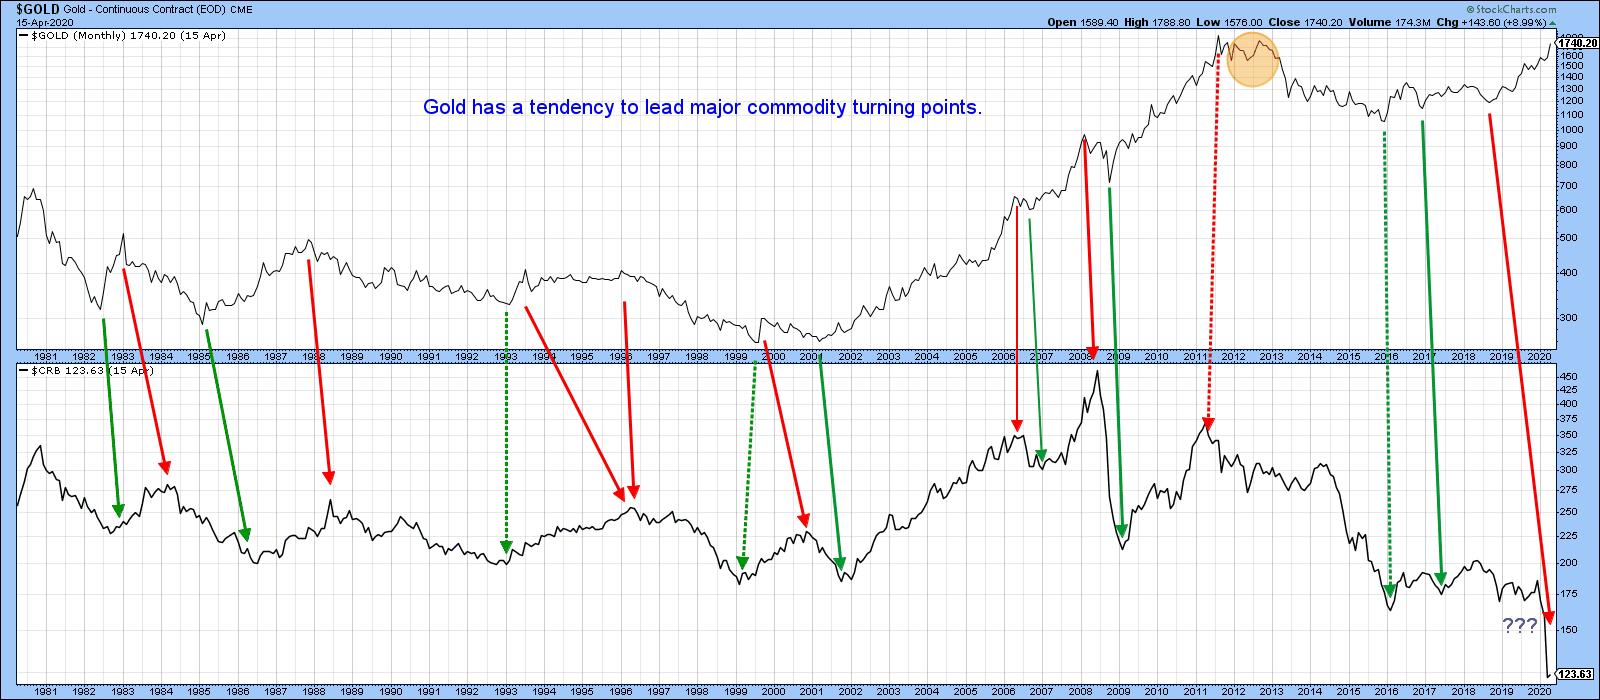
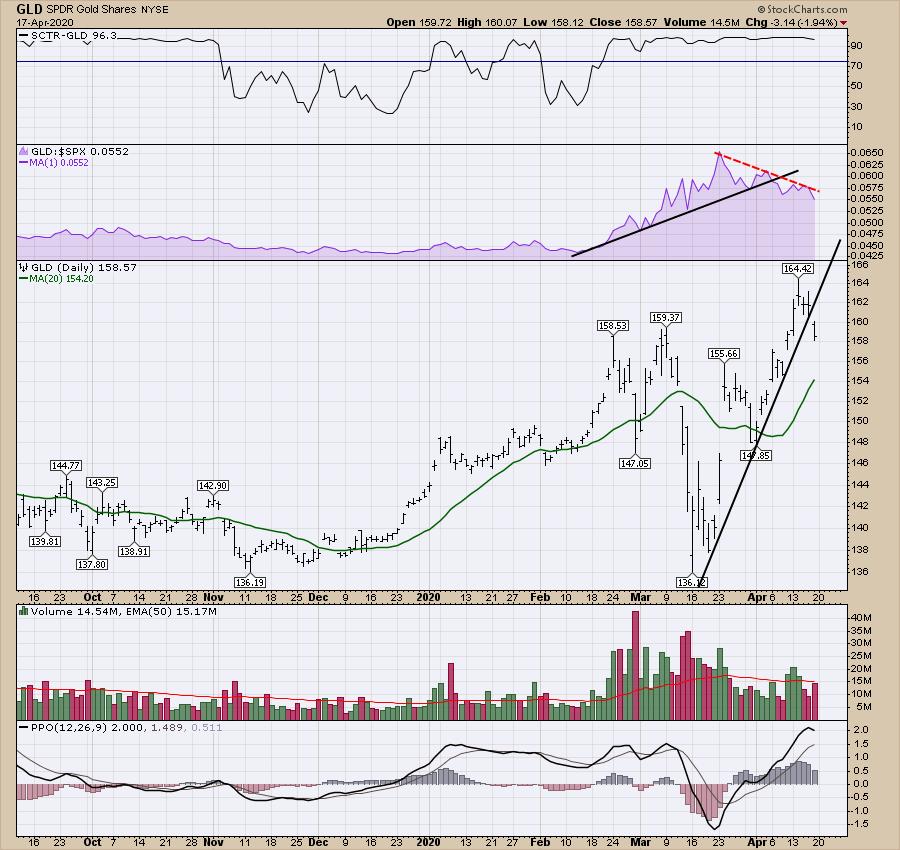
History tells us that, at major turning points for commodities, there is a strong, albeit imprecise, tendency for the gold price to have preceded that reversal. Gold generally leads because a rising price anticipates inflation, while a falling one anticipates deflation... Read More
ChartWatchers April 17, 2020 at 06:42 PM
Hello Fellow ChartWatchers! This week, it's story time... Read More
ChartWatchers April 17, 2020 at 06:36 PM
Some promising news on a drug from Gilead Sciences (GILD) to help those with the coronavirus came out on Thursday after the market closed, which resulted in a big move in futures and a solid end to the week as traders got excited about the prospects of making progress on the pand... Read More
ChartWatchers April 17, 2020 at 05:02 PM

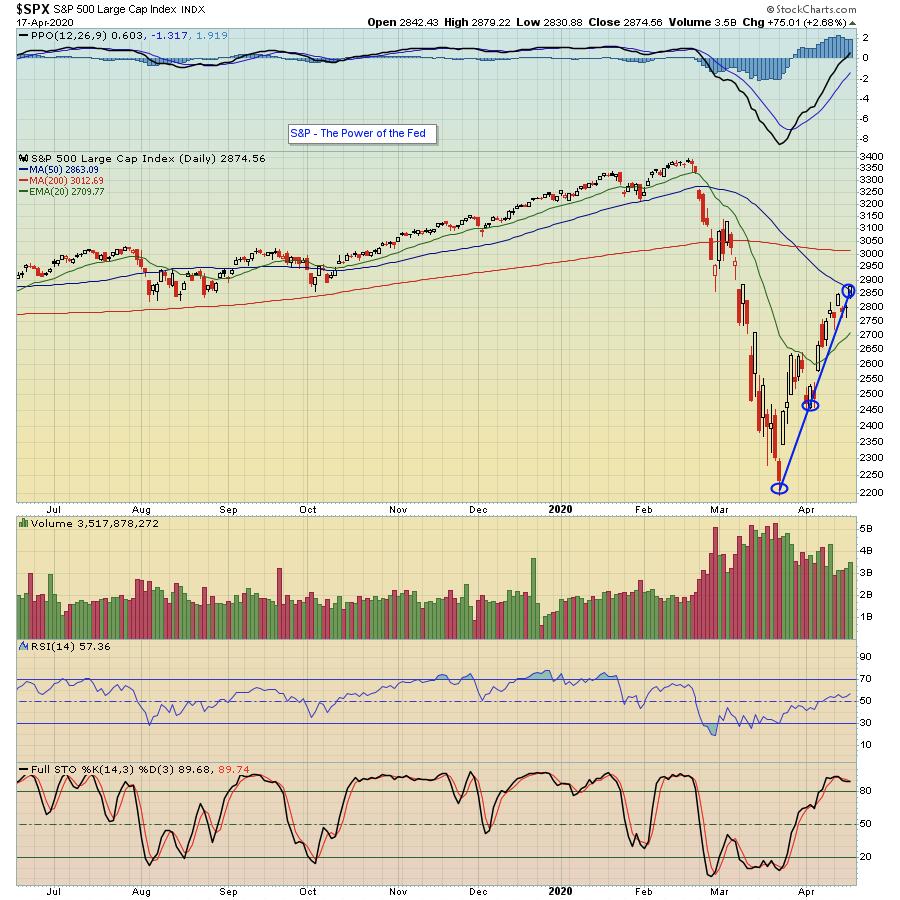
With a surge over the last 18 days, the S&P 500 reclaimed the 50-day moving average for the first time since February 21st. The move is truly remarkable, but the index remains well below the falling 200-day SMA. Moreover, a 28... Read More
ChartWatchers April 10, 2020 at 09:49 PM
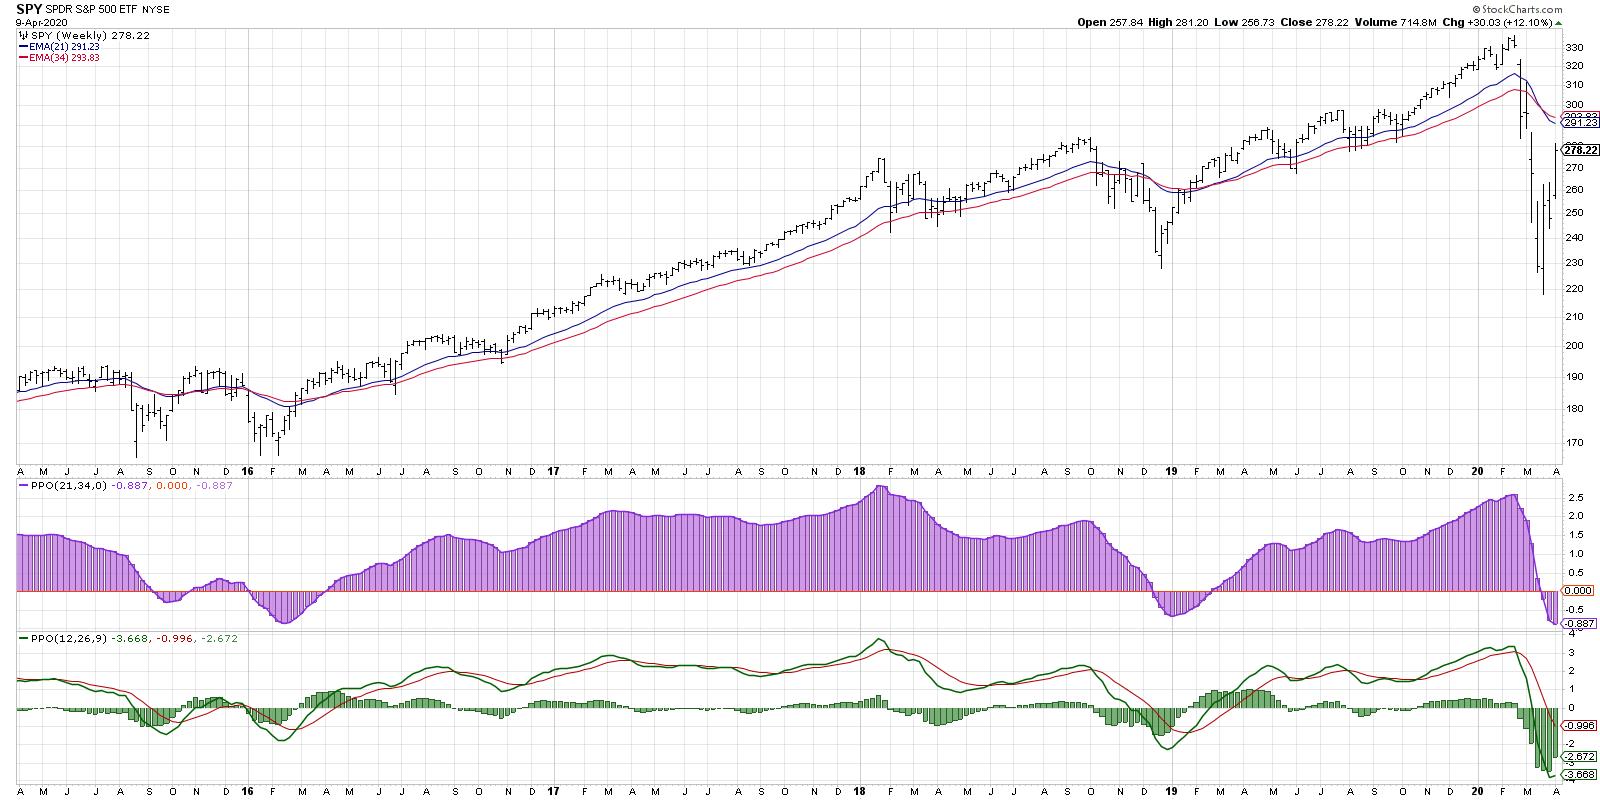
Let me give you an update as to how the SPY (ETF that tracks the S&P 500) and QQQ (ETF that tracks the NASDAQ 100) have performed since the top on February 19th, broken down by opening gaps (net) and intraday price action: SPY: Closing price, 2/19/20: 336... Read More
ChartWatchers April 10, 2020 at 08:30 PM
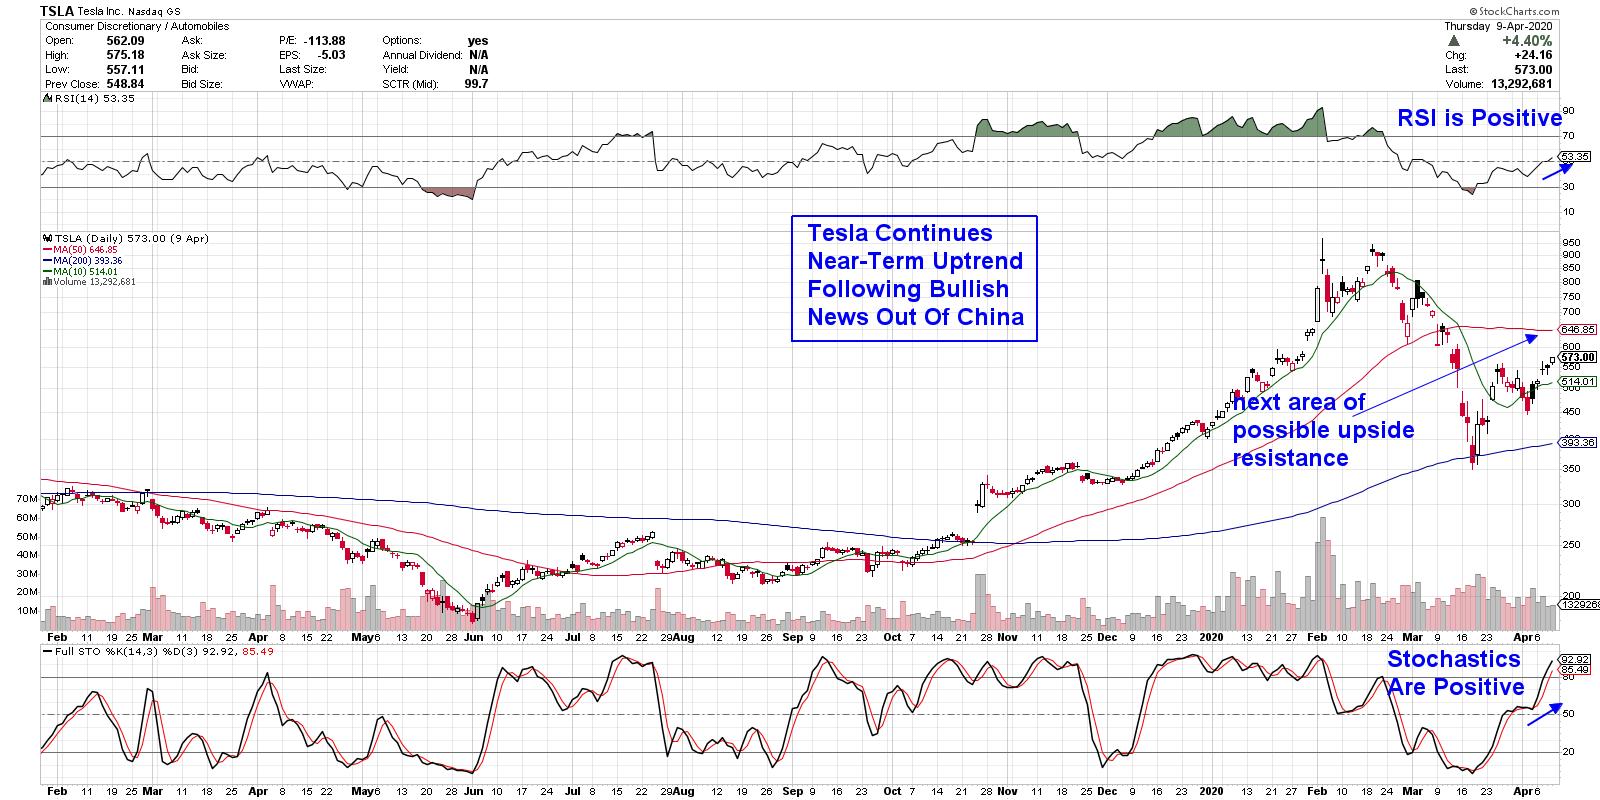
The COVID-19 pandemic has hurt the auto industry tremendously as consumer demand for vehicles has collapsed in the face of enforced lockdowns in China, Europe and now the United States... Read More
ChartWatchers April 10, 2020 at 08:14 PM
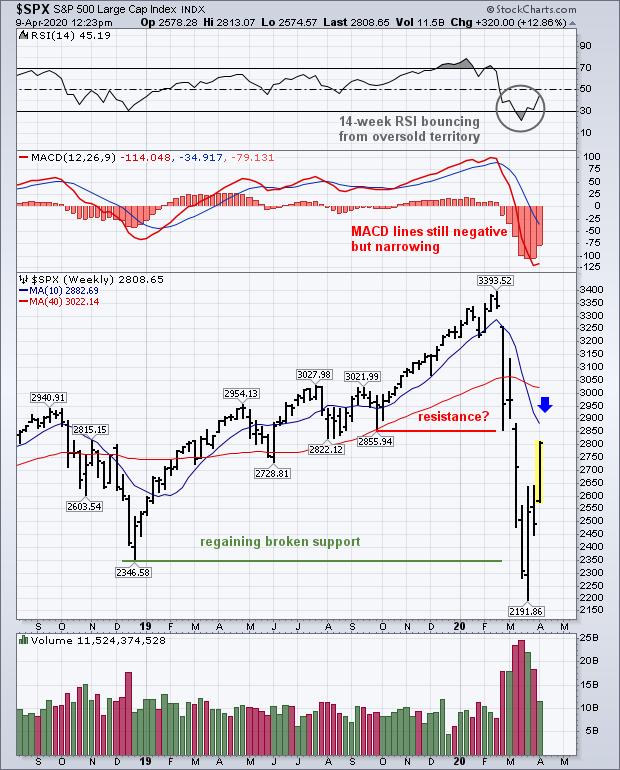
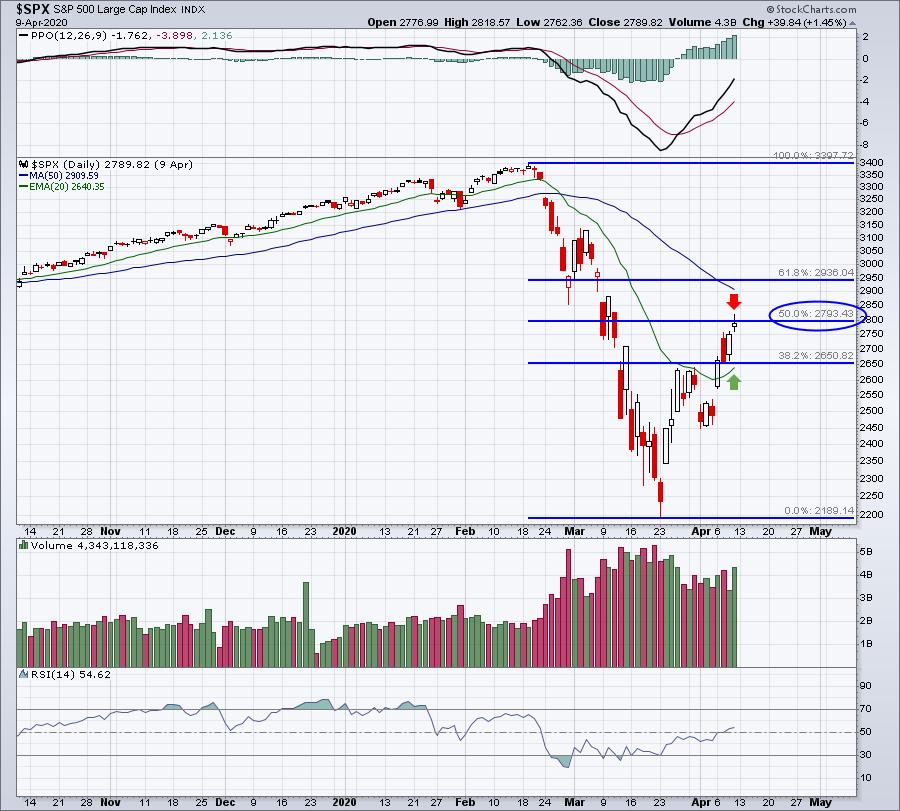
Stock prices are trading higher again today following a Fed injection of $2.3 trillion dollars into the economy. The question is how far can the rally carry, and are there still risks on the downside... Read More
ChartWatchers April 10, 2020 at 07:52 PM
As a technical analyst who started my career just after the market top in March 2000, I've had the pleasure (I guess?) of living through a number of previous bear market cycles... Read More
ChartWatchers April 10, 2020 at 03:26 PM
This week was a first for us, but it marks the start of something big – a unique integration between the content you follow from our team of market experts and the charts that you use in your own StockCharts account. Allow me to explain... Read More
ChartWatchers April 10, 2020 at 01:33 PM
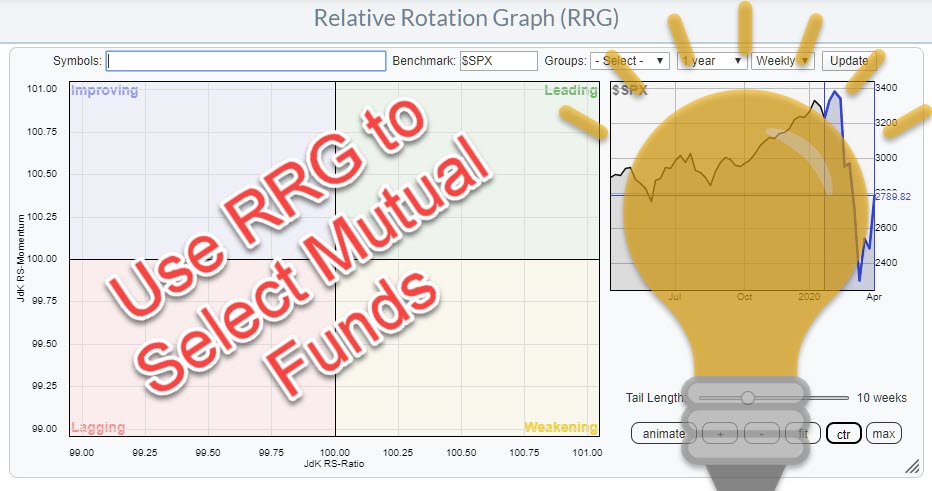
Last week on Wednesday (4/8) I wrote an article in the RRG blog on how you can use ChartLists, in combination with Relative Rotation Graphs to monitor your mutual fund portfolio... Read More
ChartWatchers April 03, 2020 at 11:00 PM
Major U.S. stock indexes continue to probe for a short-term bottom. The daily bars in Chart 1 show the S&P 500 regaining some lost ground over the last two weeks after falling to the lowest level in three years. But there's still a lot of overhead resistance to deal with... Read More
ChartWatchers April 03, 2020 at 09:12 PM
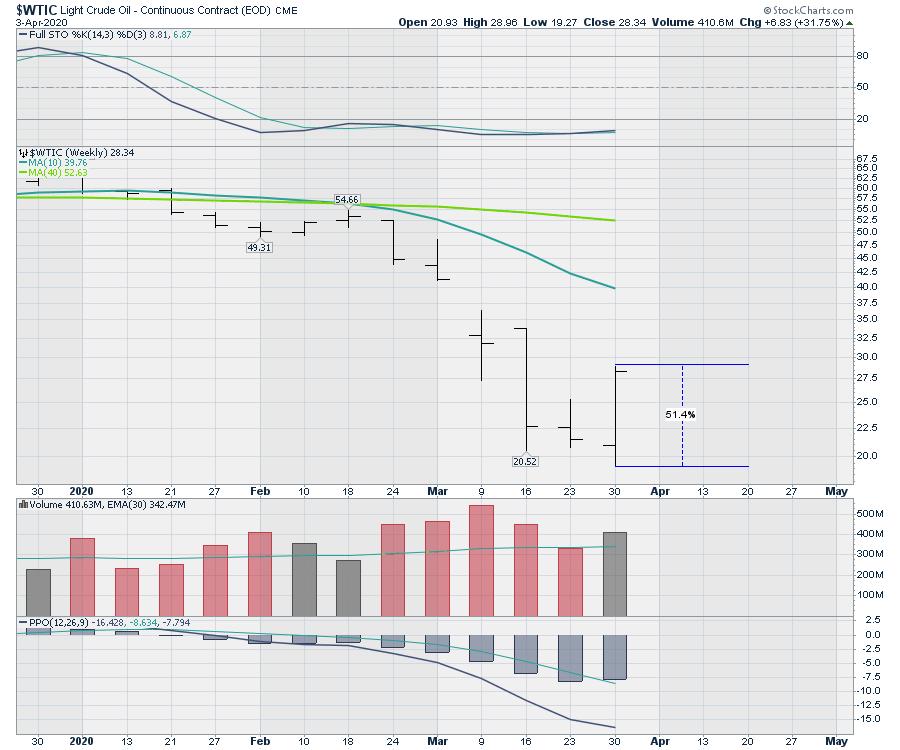
It has been a wild ride for those on the crude oil train this week. It's never good when your stocks are riding pandemic viruses, tweet storms, kingdoms, autocratic leaders and democracies trying to impose volume limits... Read More
ChartWatchers April 03, 2020 at 06:45 PM
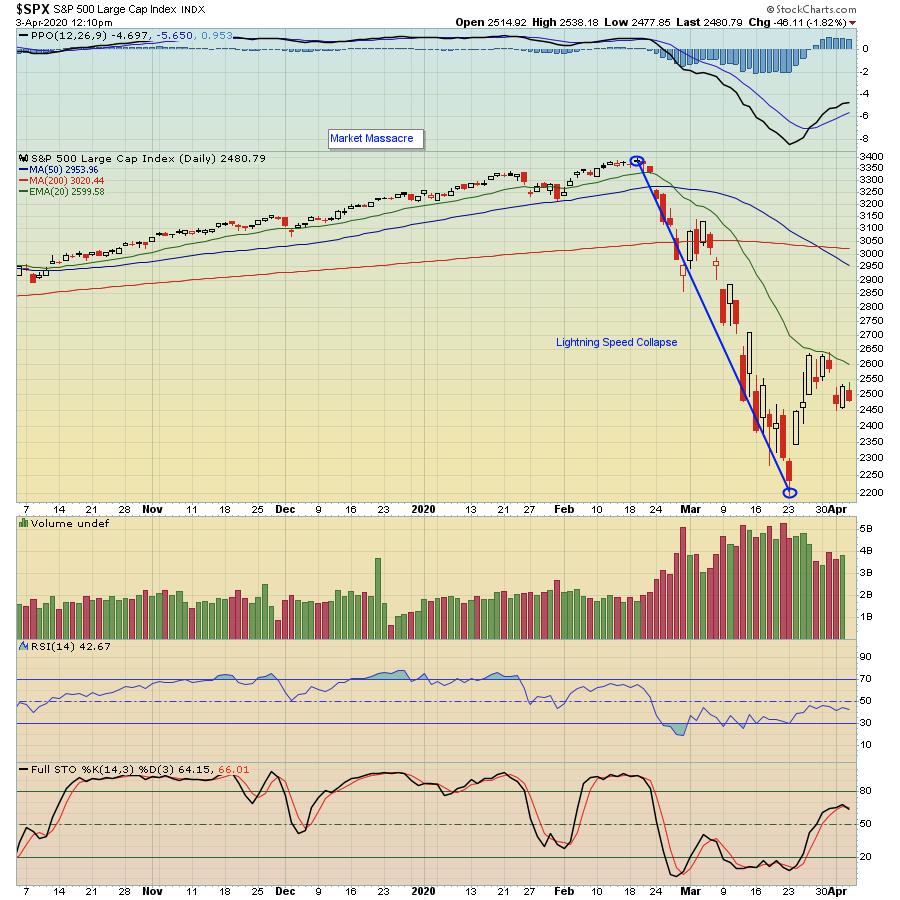
If there ever was a time to be worried about where the market could be headed, this is it. We've seen the weekly jobless claims go from a boring week-to-week reading of just over 200,000 all the way to now 6 million over the course of a month... Read More
ChartWatchers April 03, 2020 at 05:32 PM
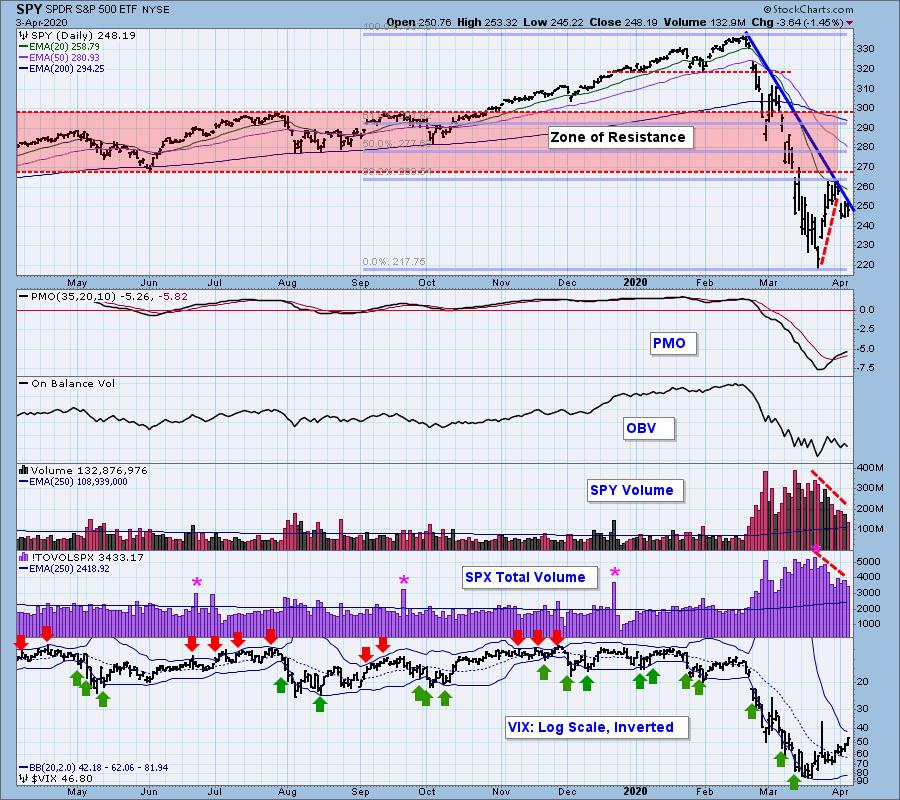
Today's ChartWatchers article is an updated excerpt from the DecisionPoint Alert Report for subscribers: I pointed out to my subscribers on Thursday that, with all of the volatility, our short-term indicators seem to be more on point than usual... Read More
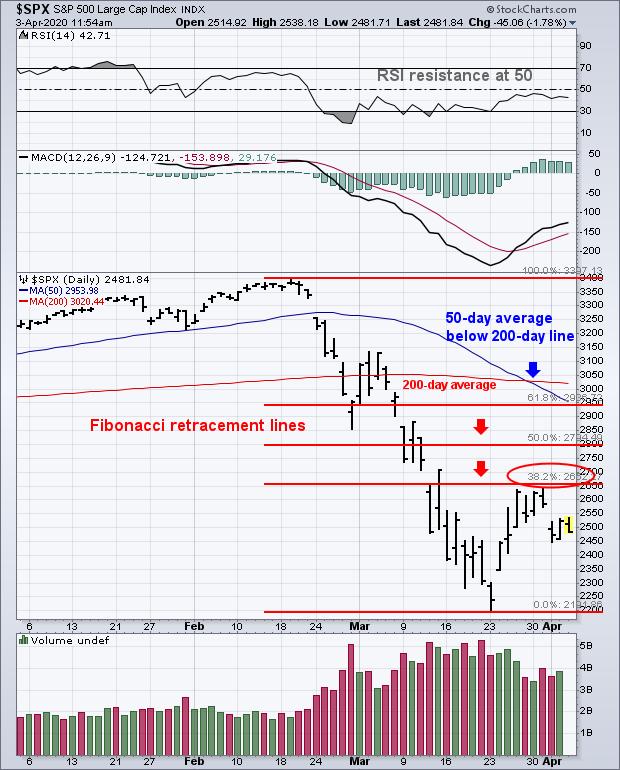
ChartWatchers April 03, 2020 at 04:50 PM

The S&P 500 went from a historic decline to a historic bounce to an above average drop. This key benchmark fell 33.9% in 23 days, surged 17.55% in three days and then dropped 5.25% the last four days... Read More