ChartWatchers September 29, 2023 at 06:00 PM

As Q3 and a dismal September end, some interesting dynamics are playing out in the stock market. You can blame higher interest rates for some of the disjuncture that's going on... Read More
ChartWatchers September 26, 2023 at 05:27 PM
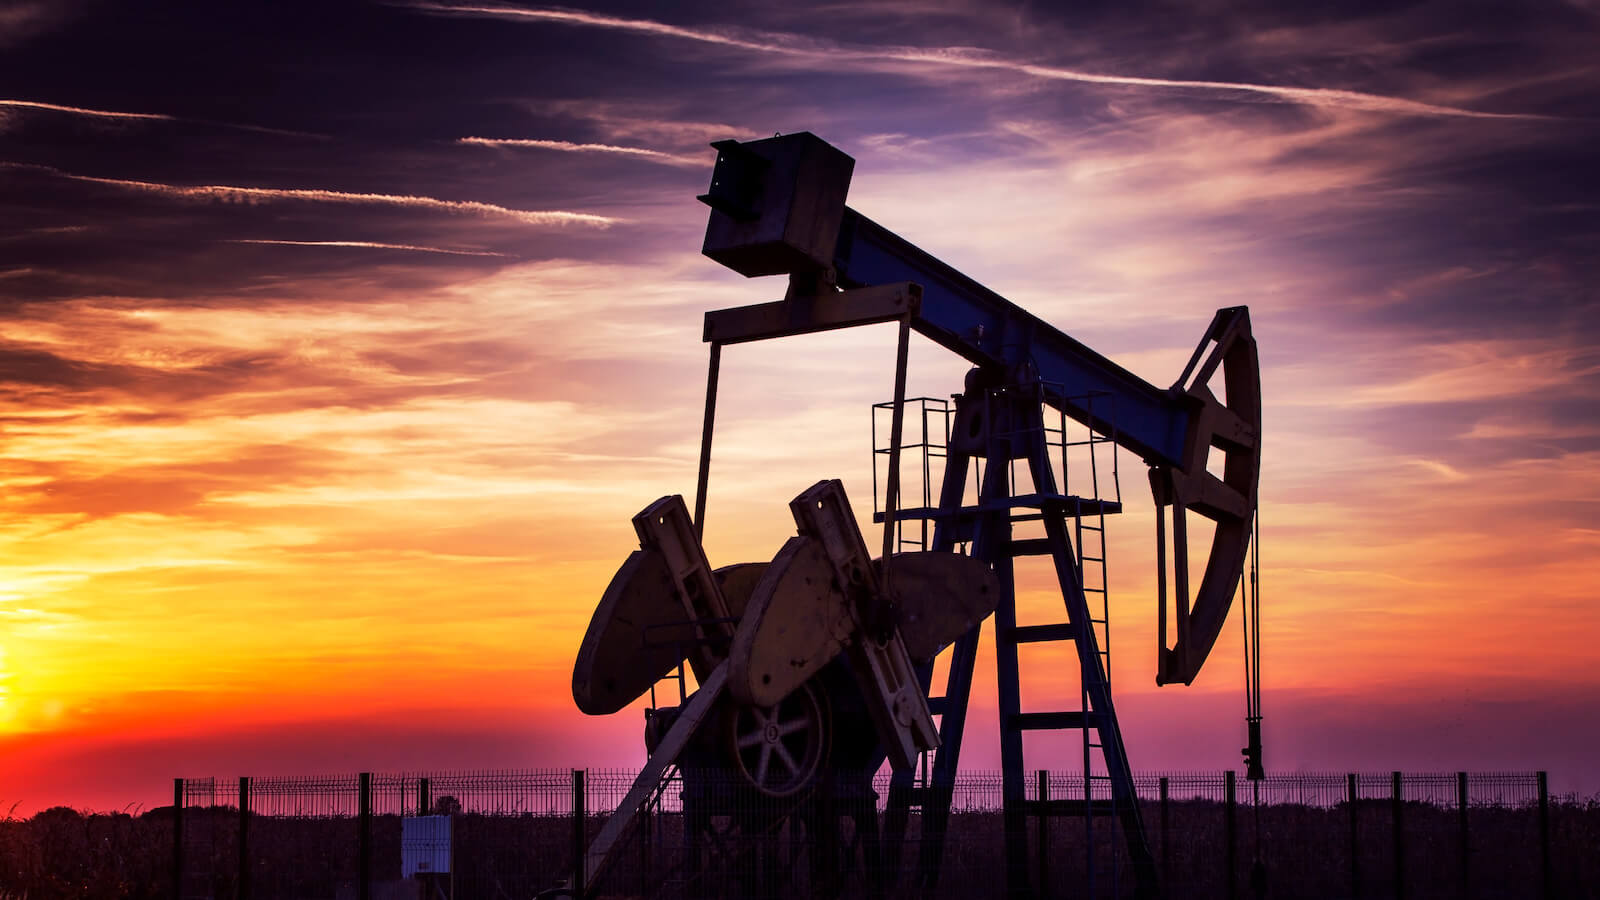
The Energy sector has the highest percentage of analyst buy ratings (around 64%) of all S&P sectors in the US stock market. The kicker, however, is that these same analysts project Energy to have the smallest price increase (a mere 10.7%) among all sectors in the next 12 months... Read More
ChartWatchers September 25, 2023 at 04:34 PM
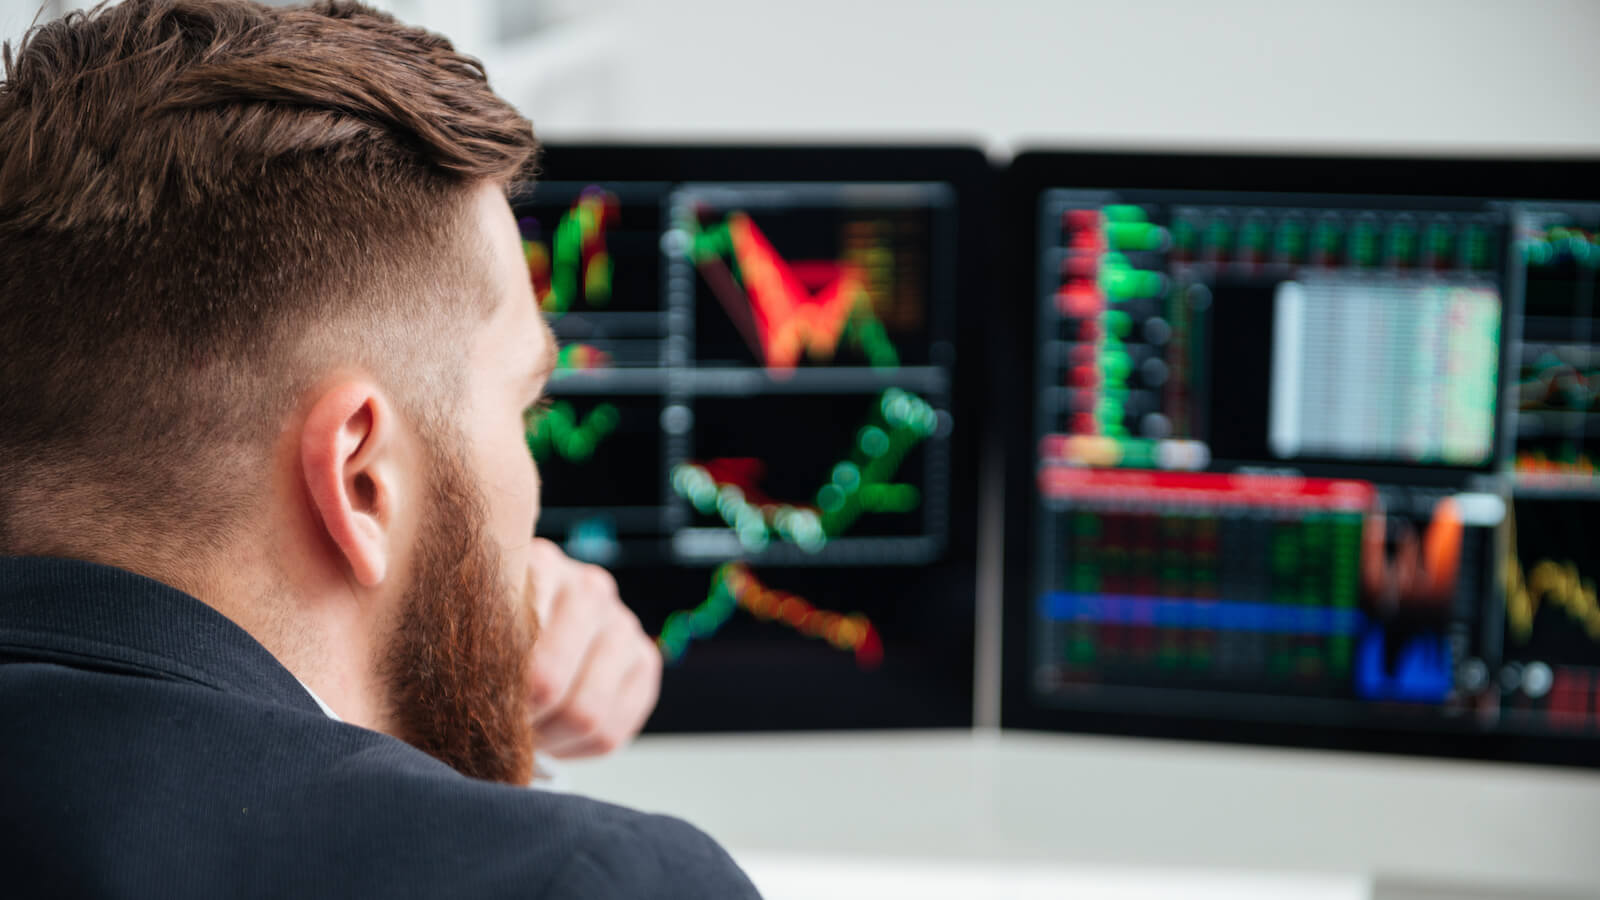
Last week wasn't the most optimistic on Wall Street. Even though the US economy is growing, Federal Reserve Chairman Jerome Powell's comments after the Fed meeting weren't what investors wanted to hear. The Federal Reserve's decision to keep interest rates steady at 5.25–5... Read More
ChartWatchers September 21, 2023 at 05:34 PM
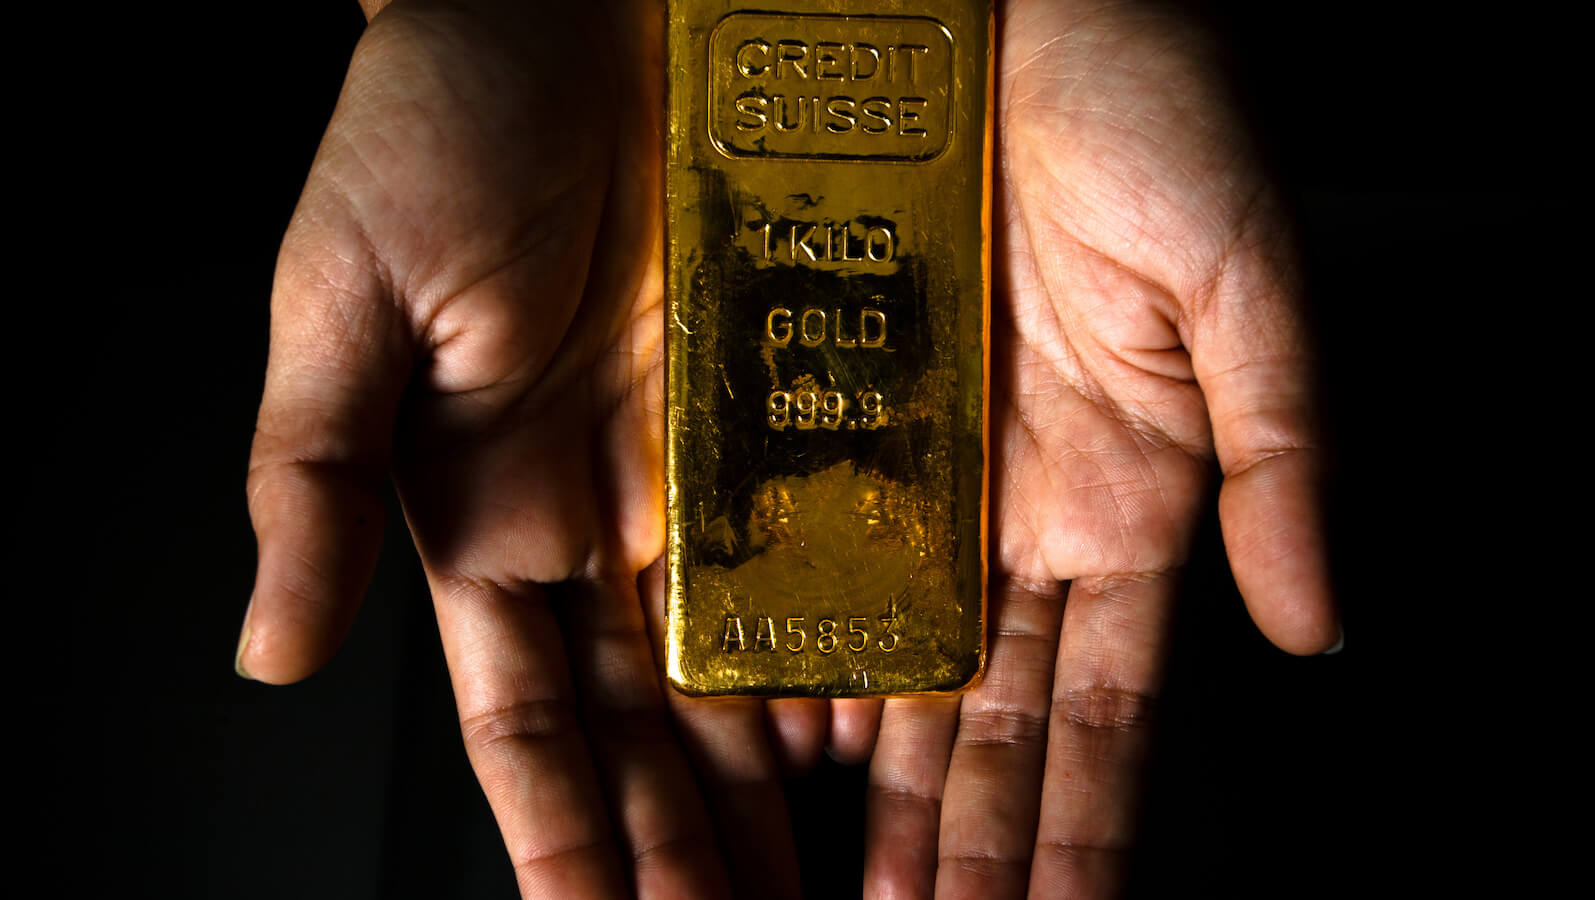
Gold has been hovering in a range over the last three months. It's as if the yellow metal was waiting for something major to knee-jerk its trajectory. Maybe you're bullish on gold for reasons straying beyond mainstream economic or geopolitical uncertainties... Read More
ChartWatchers September 20, 2023 at 04:57 PM
Successful market timing relies on choosing the right market to time. In the StockChartsACP suite of Larry Williams plug-in indicators, three of them—Williams True Seasonal, Williams Money Flow Index, and Williams Sentiment Index—were designed with that purpose in mind... Read More
ChartWatchers September 18, 2023 at 05:21 PM

Traders and investors don't generally look forward to September. Besides being the end of summer vacations and back-to-school season, the stock market usually hits its weakest point at this time of the year... Read More
ChartWatchers September 15, 2023 at 02:46 PM

The Ichimoku Kinko Hyo (or Ichimoku for short) is like a Swiss army knife of an indicator, designed for everything from projecting support and resistance to identifying trade signals... Read More
ChartWatchers September 08, 2023 at 05:59 PM
"September is when leaves and stocks tend to fall; On Wall Street, it's the worst month of all."— Stock Trader's Almanac... Read More
ChartWatchers September 08, 2023 at 05:03 PM
Every trader has preferred ways to find market opportunities and select tradable stocks. Among these methods, which exist in great numbers, are those that concern "seasonality" or market patterns that tend to repeat, according to the calendar... Read More
ChartWatchers September 01, 2023 at 06:04 PM
The much-awaited August jobs report was released on Friday. While it came in higher than estimates—187K vs. 170K jobs created—there were other areas of the report that eclipsed the stronger-than-expected figure... Read More
ChartWatchers September 01, 2023 at 11:00 AM

Contrarian wisdom is nothing new to the market's ears, and it probably speaks to you with some familiarity. You know what it generally says ... "Be fearful when others are greedy, and greedy when others are fearful... Read More